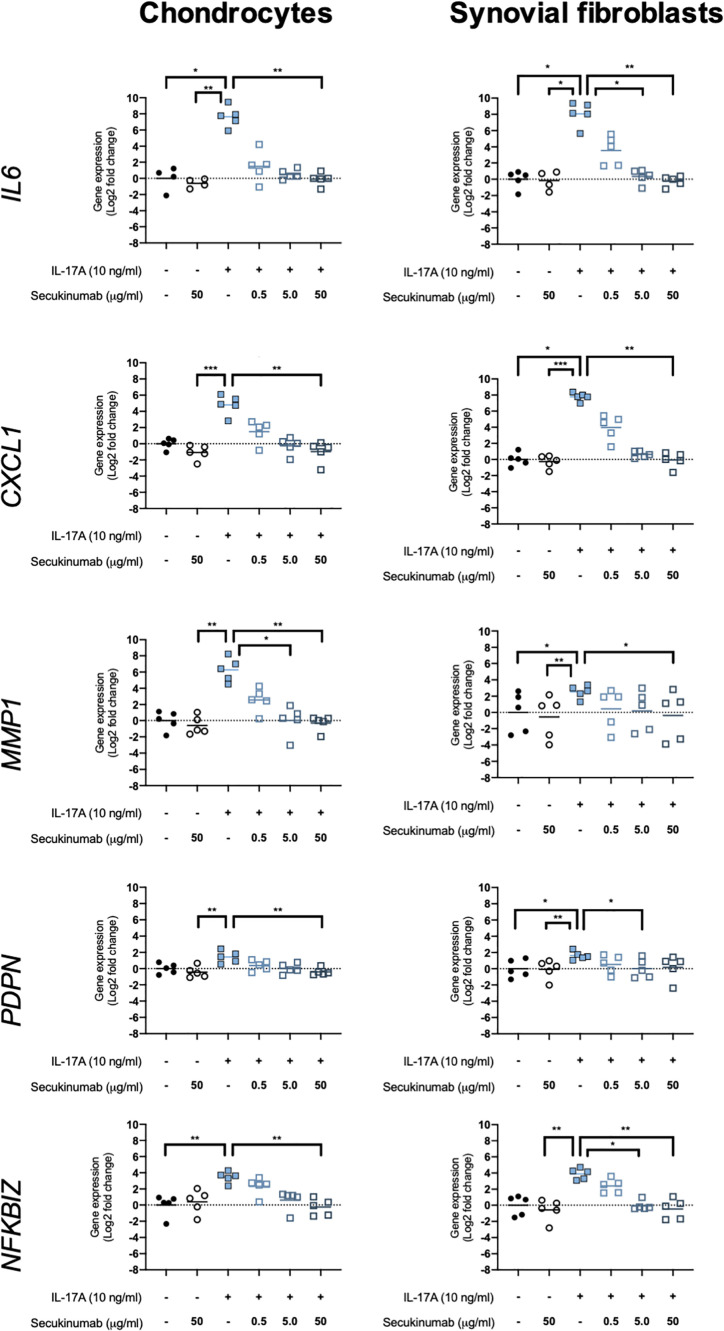
Figure 6.
Gene expression of chondrocytes and synovial fibroblasts after treatment with IL-17A (10 ng/ml) with or without clinically-used IL-17A-antibody secukinumab in different concentrations (0.5, 5.0, or 50 μg/ml). Gene expression was calculated using the ddCT-method using both GAPDH and ACTB as housekeepers. Gene expression is expressed as log2 fold change compared to control. Changes in gene expression were calculated comparing each treatment to IL-17A treatment alone. Kruskal-Wallis test with Dunn’s multiple comparisons test (IL6). Friedman test with Dunn’s multiple comparisons test (all other genes). Individual values and mean. N=5. *p < 0.05, **p < 0.01, ***p < 0.001.

