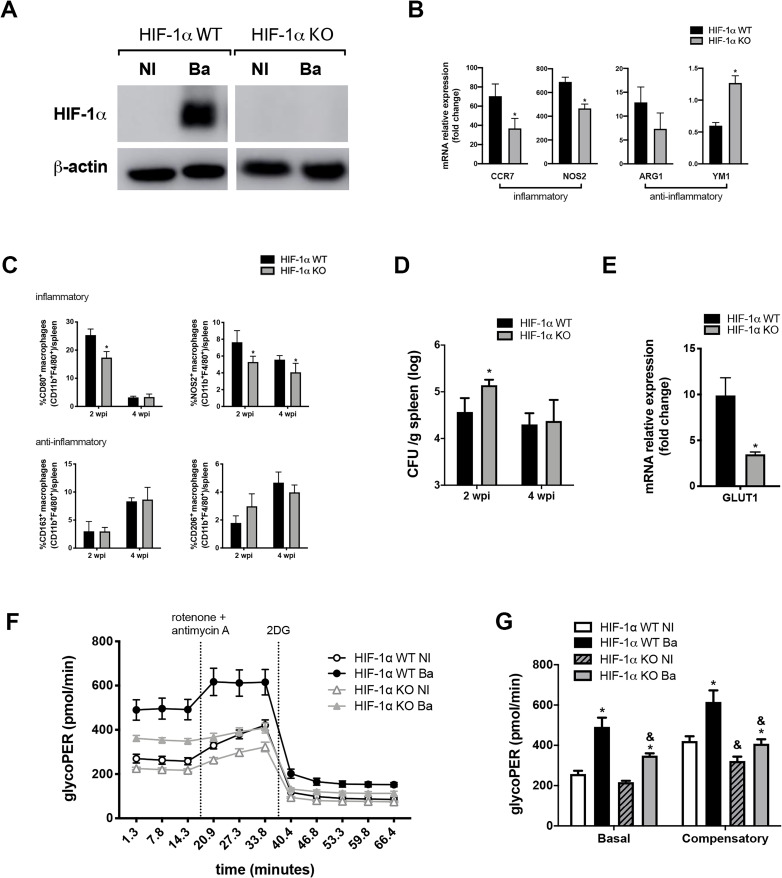
Fig 2. Metabolic reprogramming in infected macrophages requires HIF-1α.
(A) Western blot analysis of HIF-1α in cell lysates from macrophages derived from HIF-1α WT or HIF-1α KO mice, non-infected (NI) or infected with B. abortus (Ba). Equal loading was controlled by measuring β-actin in the corresponding cell lysates. (B) CCR7, NOS2, ARG1, and YM1 expression levels determined by real-time RT-PCR in B. abortus-infected macrophages derived from HIF-1α WT or HIF-1α KO mice. (C) Frequency of CD80+F4/80+CD11b+, NOS2+F4/80+CD11b+, CD163+F4/80+CD11b+ and CD206+F4/80+CD11b+ cells measured by flow cytometry analysis in spleen cells from infected HIF-1α WT or HIF-1α KO mice, at 2 or 4 weeks post-infection (wpi). Representative plots of analysis are shown in S4 Fig. (D) CFU numbers in spleen homogenates of HIF-1α WT and HIF-1α KO mice infected intraperitoneally with B. abortus at 2 or 4 weeks post-infection (wpi). (E) GLUT1 expression levels determined by real-time RT-PCR in B. abortus infected-macrophages derived from HIF-1α WT and HIF-1α KO mice. (F) Time-course quantification of glycolytic proton efflux rate (glycoPER) in macrophages derived from HIF-1α WT and HIF-1α KO mice, non-infected (NI) or infected with B. abortus (Ba). (G) Quantification of basal and compensatory glycoPER. The data are representative of three (A-E) or two (F and G) independent experiments. The data (B-C and E) are presented as mean ± SD, *p < 0.05, Student’s t test. The data (D) is presented as mean ± SD, *p < 0.05, two-way ANOVA. The data (G) is presented as mean ± SD, * (comparison between NI and Ba) or & (comparison between WT and KO), p < 0.05, two-way ANOVA.

