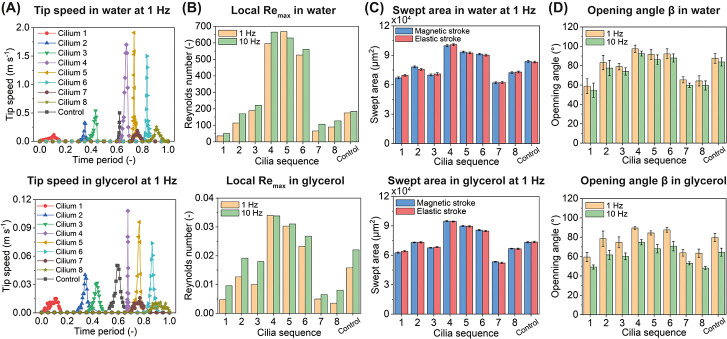
Figure 4.
Quantitative analyses of the μMAC motion in both water and glycerol. (A) Tip speed of the μMAC array with a pitch of 550 μm during one beating cycle at 1 Hz. T = 0 corresponds to t = 0 s as shown in Figure 3A. The peak of the tip speed occurs during the elastic stroke of each cilium, and the time difference between these peaks represents the phase difference of the μMAC motion. (B) Calculated local maximum Reynolds number at 1 and 10 Hz based on the maximum tip speed in panel A and Figure S6A. See S7 for details about the calculation. (C) Swept area by the μMAC during the magnetic stroke and the elastic stroke at 1 Hz, respectively, showing that there is no difference in the swept area during the two strokes, indicating that the μMAC motion is symmetric. (D) Opening angle (β in Figure 3D) of the μMAC motion at 1 and 10 Hz. The tip speed and swept area of the μMAC motion at 10 Hz in both water and glycerol can be found in Figure S6. Each data point in panel (C,D) was obtained by averaging the results of at least three measurements.

