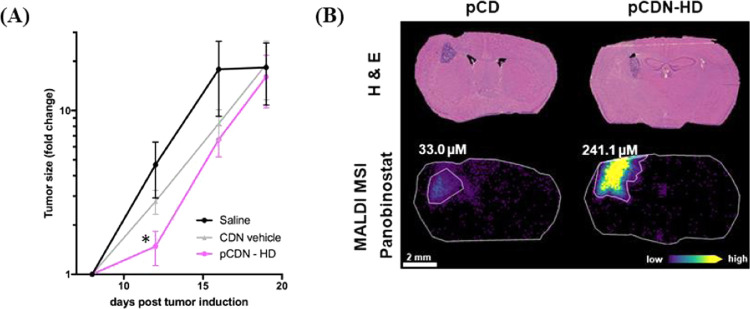
Figure 11.
(A) Tumor growth determined by the change in the tumor size (mean ± standard error of the mean (SEM)) for saline (n = 9), CDN vehicle (n = 9), and pCDN-HD (n = 10)-treated mice. The fold change in tumor size was significantly decreased 4 days following treatment for pCDN-HD mice compared to CDN vehicle control (p = 0.03, two-tailed Student’s t-test). (B) Mass spectrometry imaging of pCD and pCDN-HD distribution in the GL261 mouse model following 1 h after intratumoral convection-enhanced delivery (8 days post tumor induction). Brightfield microscopy imaging of hematoxylin and eosin (H&E) stained tissue sections shows the tumor in striatum. The molecular ion images of panobinostat from an animal treated with pCD (1 μg dose) show drug level below the lower limit of quantification (LOQ) for the nontumor brain region (3.6 μM) with a localized 33.0 μM concentration in the tumor. The pCDN-HD (30 μg dose)-dosed animal also showed drug levels below the LOQ for the nontumor brain region (6.0 μM) and a localized 241.1 μM concentration in the tumor region.

