Figure 3.

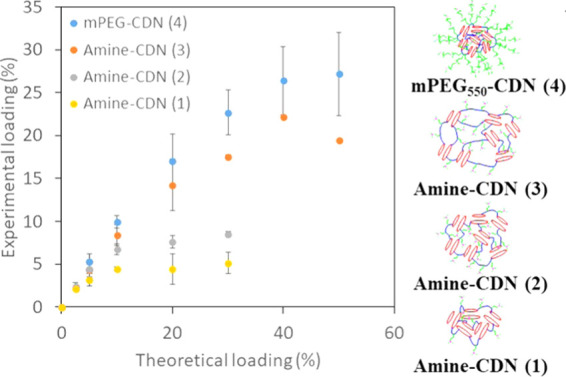
Plot of measured panobinostat loading for CDNs 1–4 as a function of different theoretical loadings. Error bars show standard deviations of at least three independently formulated batches.

Plot of measured panobinostat loading for CDNs 1–4 as a function of different theoretical loadings. Error bars show standard deviations of at least three independently formulated batches.