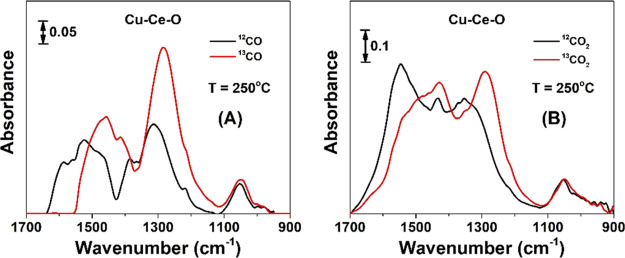
Figure 8.
(A) SSITKA-DRIFTS spectra recorded in the 1700–900 cm–1 IR region after 30 min in 12CO/O2 at 250 °C following the step-gas switch 12CO/O2 (30 min) → 13CO/O2 (5 min) for the Cu–Ce–O solid. Feed gas composition of nonisotopic and isotopic gas: 12CO or 13CO = 4 vol %, O2 = 20 vol %, balance Ar; FT = 50 N mL min–1. (B) DRIFTS spectra recorded in the 1700–900 cm–1 IR region after 30 min in 12CO2/O2 followed by the step-gas switch 12CO2/O2 → 13CO2/O2 (5 min) for the CeO2, Zn–Ce–O, and Cu–Ce–O solids. Feed gas composition of nonisotopic and isotopic gas: 12CO2 or 13CO2 = 2 vol %, O2 = 20 vol %, balance Ar; FT = 50 N mL min–1.

