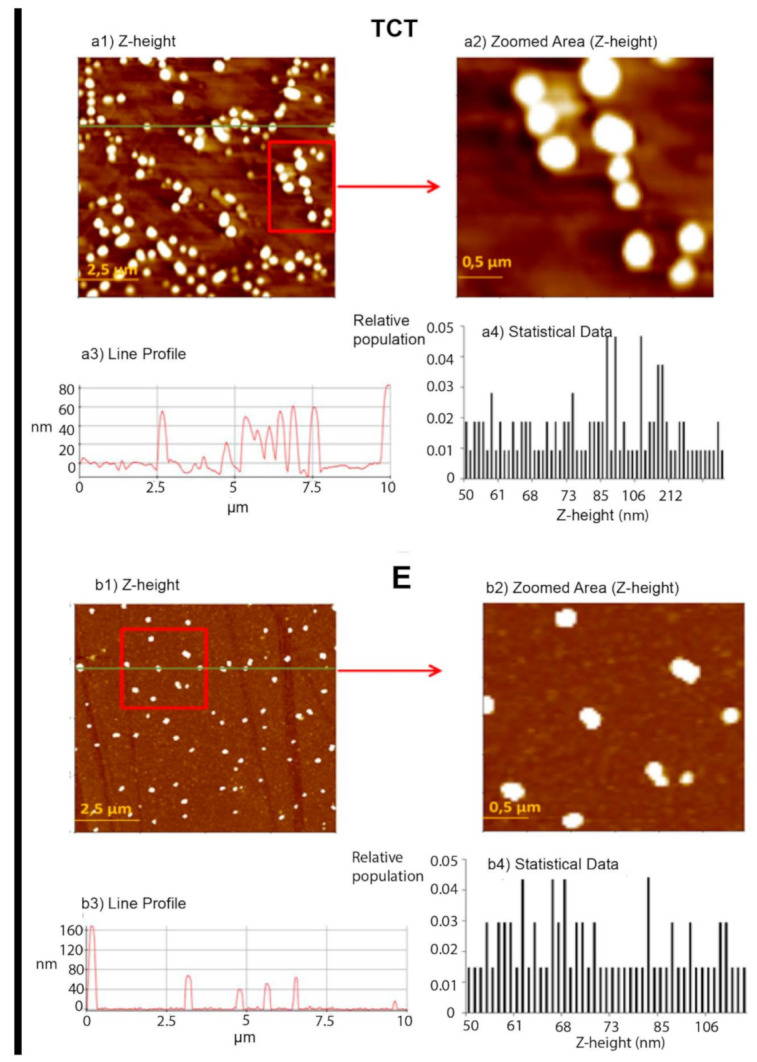
Figure 5.

Representative images of EVs of TCT (a) and EVs of E (b) of T. cruzi Pan4 strain. (a1) Z-height image of EVs of TCT; (a2) zoomed area from image a1; (a3) line profile for the green line in the topography image (Z-height is in the range 40–80 nm) and (a4) statistical data of the relative frequency of the Z-height (nm). (b1) Z-height image of EVs of E; (b2) zoomed area from image b1; (b3) line profile for the green line in the topography image (Z-height is in the range 40–160 nm) and (b4) statistical data of the relative frequency of the Z-height (nm).
