Figure 6.

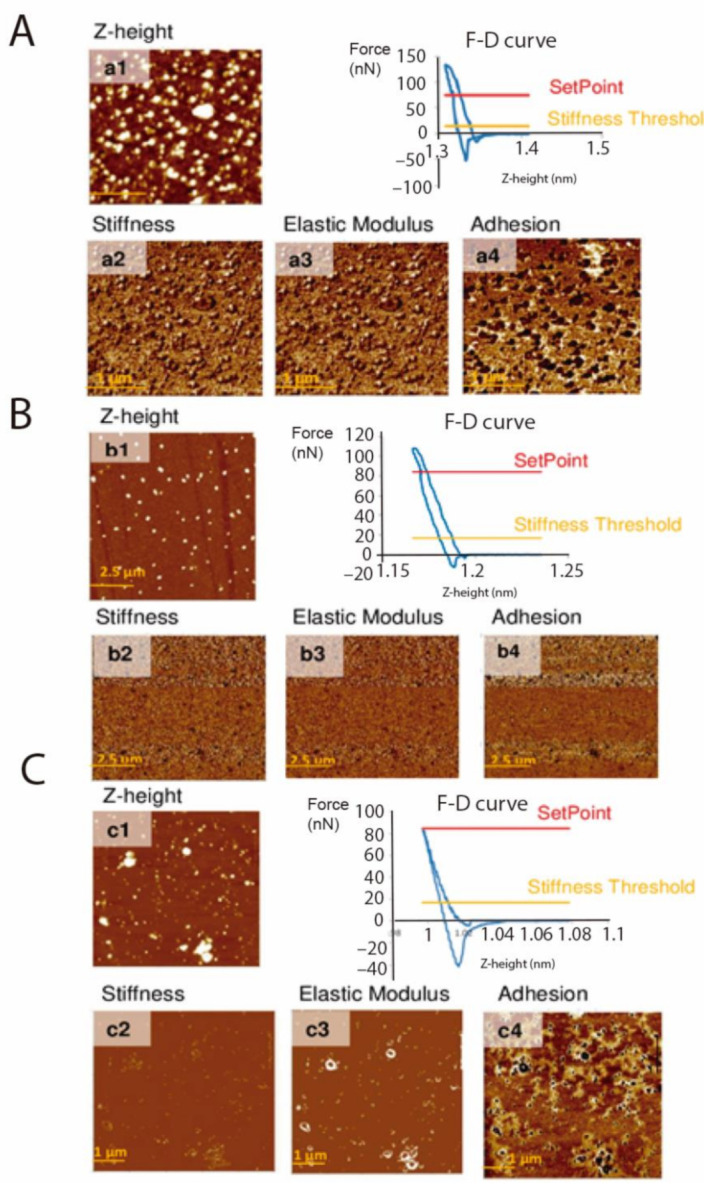
Atomic force microscopy Z-height images and nanomechanical maps showing stiffness, elastic modulus and adhesion profile of EVs of TCT (A), EVs of E (B) and EVs of TCT treated with proteinase K (C).

Atomic force microscopy Z-height images and nanomechanical maps showing stiffness, elastic modulus and adhesion profile of EVs of TCT (A), EVs of E (B) and EVs of TCT treated with proteinase K (C).