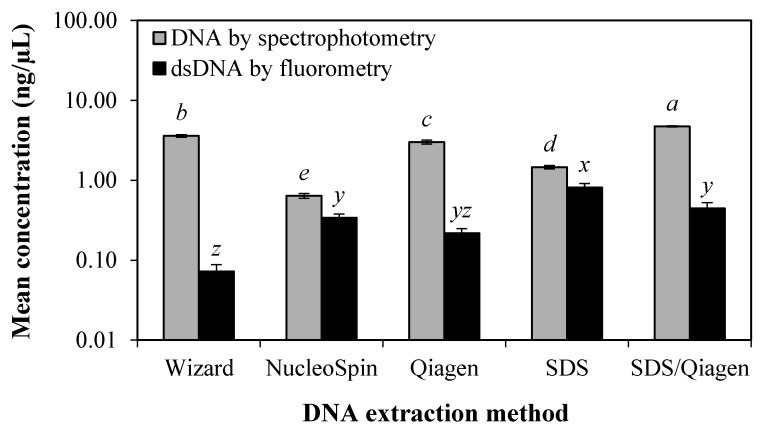
Figure 1.
Mean DNA and dsDNA concentrations of EBN samples extracted with five different DNA extraction methods as measured by spectrophotometry and fluorometry, respectively. Different letters in each quantification method indicate significant differences (p < 0.05). Values are mean ± standard error with samples size n = 52 (spectrophotometry) and n = 13 (fluorometry).

