Figure 1.
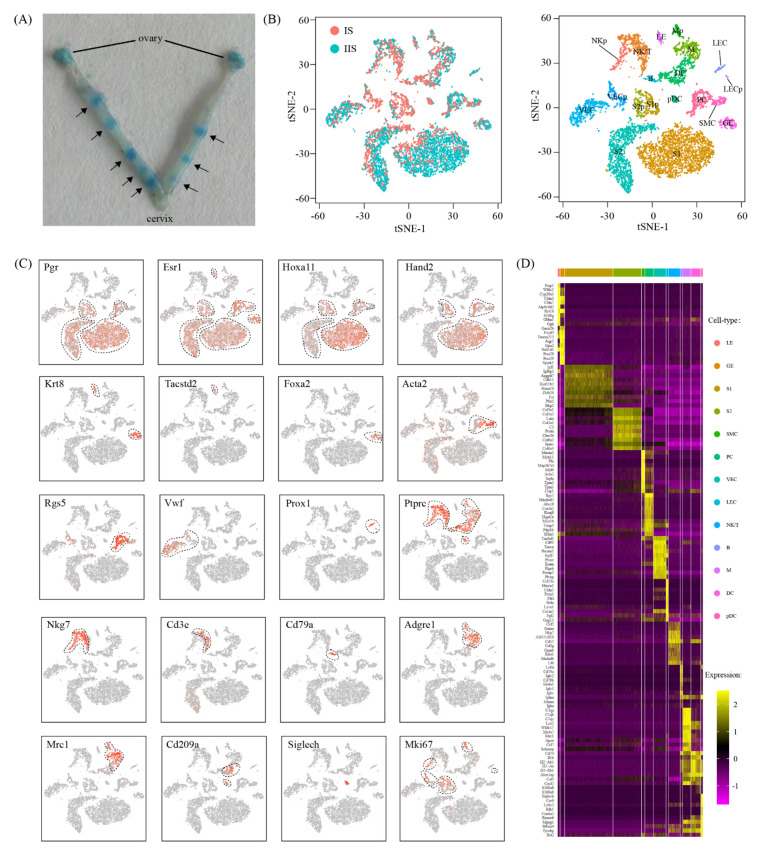
Single-cell transcriptome analysis of the implantation site in mouse uterus on gestational day 5: (A) A photograph of mouse uterus on gestational day 5. The position of embryo implantation sites was marked with an arrow. (B) The t-stochastic neighbor embedding (tSNE) representation of single-cell RNA-seq data obtained from implantation sites (IS) and inter-implantation sites (IIS). Single cells were grouped by cellular origin (left) and cell clusters (right). LE: luminal epithelial cells; GE: glandular epithelial cells; S1: superficial stromal cells; S2: deep stromal cells; S1p: proliferating superficial stromal cells; S2p: proliferating deep stromal cells; SMC: smooth muscle cells; PC: pericytes; VEC: vascular endothelial cells; VECp: proliferating vascular endothelial cells; LEC: lymphatic endothelial cells; VECp: proliferating lymphatic endothelial cells; M: macrophages; DC: dendritic cells; pDC: plasmacytoid dendritic cells; Mp: proliferating macrophages; NK/T: mixed natural killer cells and T cells; NKp: proliferating natural killer cells; B: B cells. (C) The expression pattern of canonical marker genes projected onto TSNE plots. Dashed lines denote the boundaries of the cell cluster of interest. (D) Heatmap of the top 10 gene expression signatures for each cell type.

