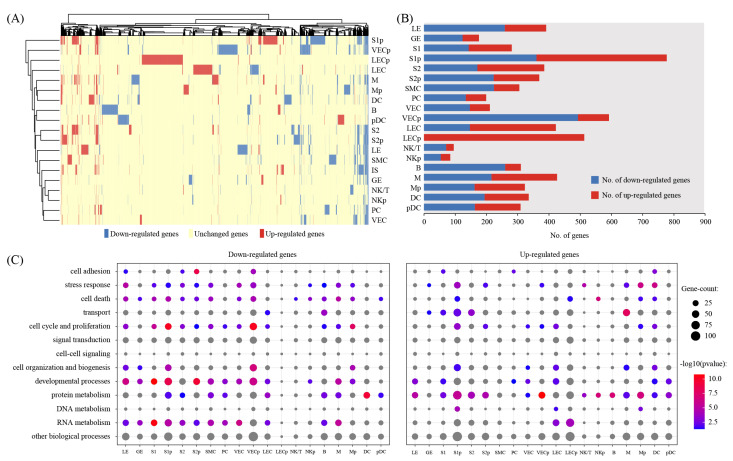
Figure 3.
Gene expression changes in implantation sites compared to inter-implantation sites: (A) Heatmap showing the distribution of differentially expressed genes (logFC > 0.25 and p < 0.05) between implantation sites (IS) compared to inter-implantation sites (IIS) in each cell type; (B) the count of differentially expressed genes in each cell type; (C) gene ontology (GO) enrichment analysis of downregulated genes and upregulated genes, respectively. p < 0.05 was used as the significance cutoff. Non-significant hits (p ≥ 0.05) are depicted in gray.

