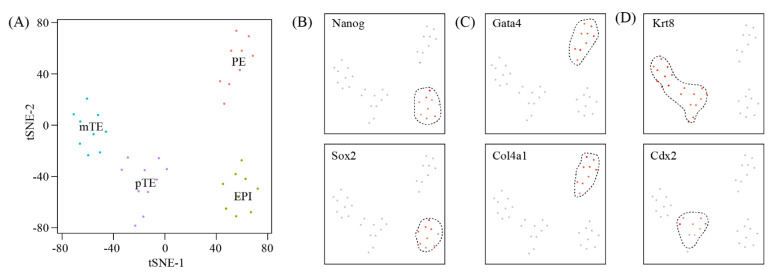
Figure 4.
A single-cell atlas of E4.5 embryos: (A) TSNE clustering of single cells from mouse E4.5 blastocysts which were collected from GD5 uteri from a previous study. EPI: epiblast; PE: primitive endoderm; mTE: mural trophectoderm; pTE: polar trophectoderm. (B–D) TSNE plots showing the expression pattern of canonical marker genes for EPI (B), PE (C) and mTE/pTE (D). Dashed lines show the boundaries of the specific cell clusters.

