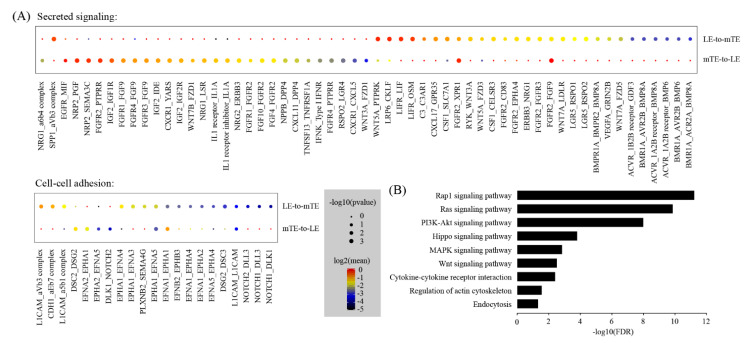
Figure 5.
Cell–cell communication between mTE and LE: (A) Dot plot showing selected ligand–receptor interactions underlying mTE-LE crosstalk. p-values are indicated by circle size and means of the average expression level of interacting molecule are indicated by color; (B) KEGG Pathway enrichment analysis of ligand–receptor pairs by using the DAVID online tools.

