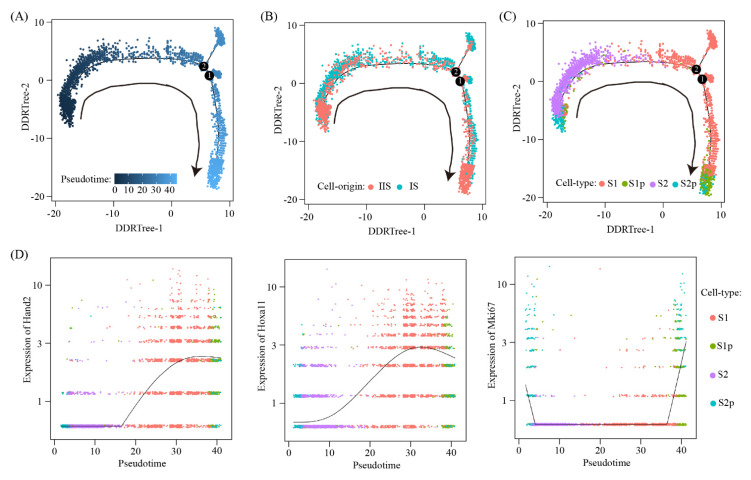
Figure 7.
Pseudotime ordering of stromal cells: (A–C) The distribution of pseudotime (A), cell origin (B) and cell type (C) across the reconstructed trajectory. The numbers inside the black circles represent the different cell status numbers identified in the trajectory analysis; (D) line plots showing gene expression dynamics of Hand2, Hoxa11 and Mki67 in the pseudotime order.

