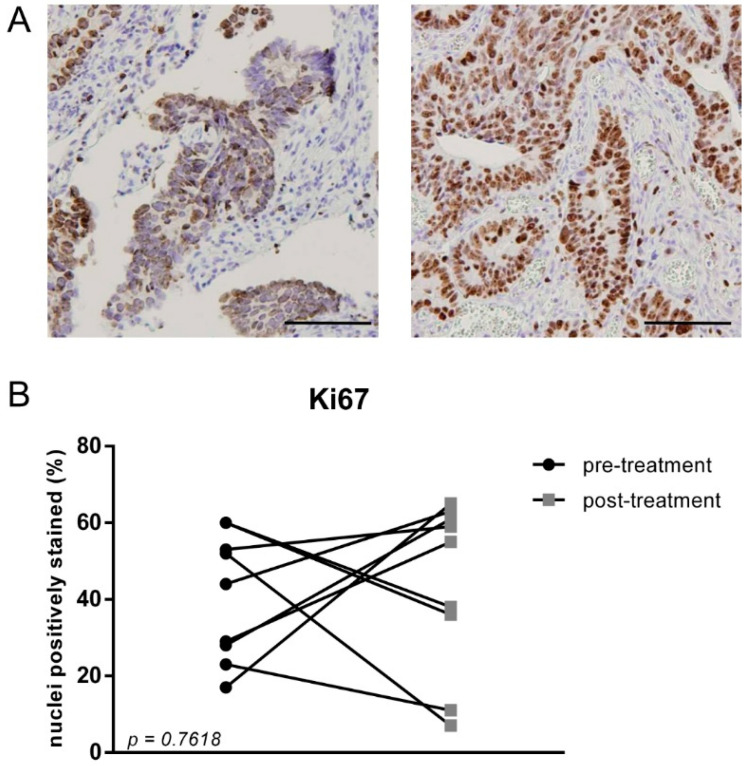
Figure 3.
(A) Representable Ki67 staining of biopsy and resection material of the tumour from one patient. The scale bar represents 100 µm; (B) Percentage of Ki67 positive cells compared to total cells from nine treated patients. A representative area of the tumour block was used for quantification. No significant difference between pre- and post-treatment samples (p = 0.7618) was observed using a paired t-test.

