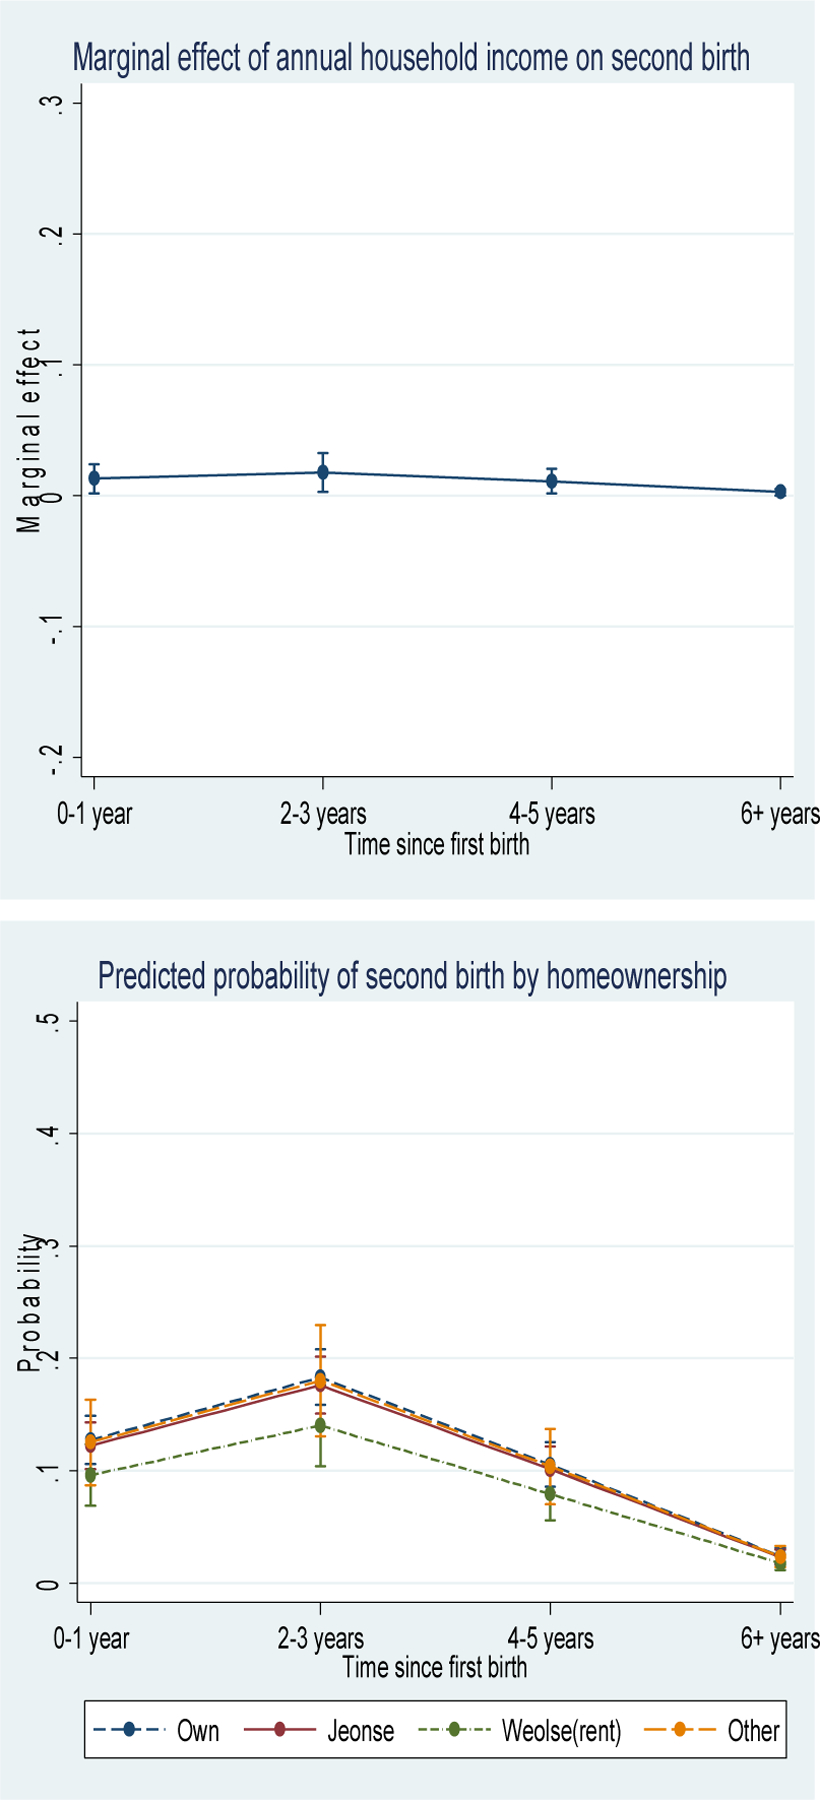
Notes: The figures illustrate probabilities of women having a second birth at each duration with 95% confidence intervals while holding all covariates at their mean across household income (the top figure) and homeownership status (the bottom figure). The figure for household income shows a marginal effect of an additional 1,000,000 KRW (approximately 850 USD) in household income (annual, logged) on second births across duration. All models include wife’s age, husband’s age, the sex of first child, place of residence, and time since first birth in the form of splines of duration, in addition to annual household income (the top figure, Model 5, Table 3) and homeownership status (the bottom figure, Model 6, Table 3).
