
Fig. 3. Epidemiological map of PRV-1 distribution and prevalence.
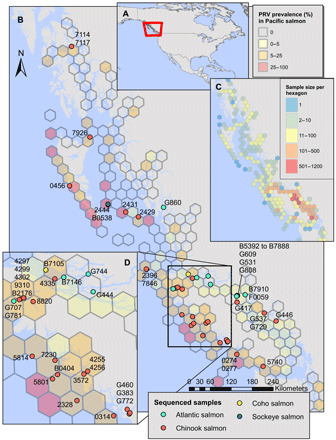
Prevalence of PRV (hexagons) along the British Columbia coastline in three wild-sampled salmon species (Chinook, n = 6412; coho, n = 2132; sockeye, n = 3845) and position of sequenced aquaculture and wild samples (points). (A) Location of BC coast on map of North America. (B) PRV prevalence and sample sites along BC coastline. (C) Sample size of wild-sampled fish per hexagon. (D) Expanded region with high sequence sample density from (B).