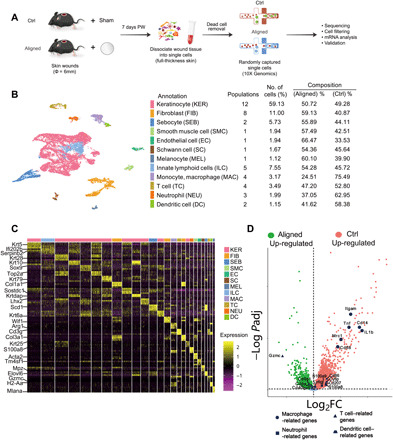
Fig. 3. Overview of the single-cell transcriptome analysis.

(A) Workflow for single-cell experiments. PW, post-wounding. (B) Cells from Ctrl and aligned samples are categorized into 12 main classes. Cell populations in each class, number of cells (%), and composition of aligned and Ctrl cells are listed. (C) Marker genes for the 26 cell clusters (12 classes). (D) Differences in gene expression between Ctrl and aligned groups. log2FC, log2 fold change.
