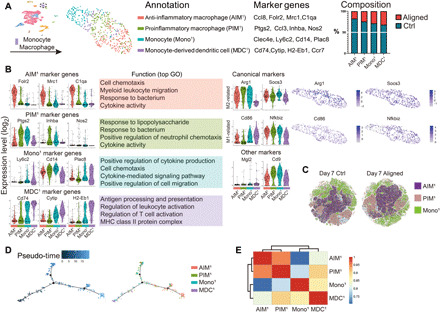
Fig. 5. Analysis of macrophages.

(A) Subclustering of macrophages showing four subsets. The marker genes and composition for each subset are listed. (B) Marker genes for each macrophage/monocyte subset and their enriched gene sets in GO analysis. Expression of canonical M1 and M2 markers and other proposed markers is shown. (C) In vivo flow cytometry strategy using CD68 to identify monocytes and macrophages. ARG1+ macrophages expressing the surface markers MRC1 and NOS2 in the gated dataset represent anti-inflammatory macrophages (AIM1) and proinflammatory macrophages (PIM1), respectively. The ARG1+LY6C+ monocytes (Mono1) are also shown. (D) Pseudo-temporal ordering of macrophage/monocytes and the distribution of four subsets along the trajectory. (E) Correlation analysis of macrophage/monocyte subsets.
