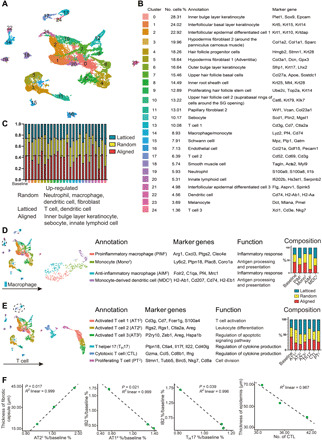
Fig. 8. Integrated analysis of three scaffolds showing differences in immune microenvironments around random, latticed, and aligned scaffolds.

(A) Cells from random, aligned, and latticed samples are clustered into 25 clusters. (B) Number of cells (%) in each cluster and their marker genes are listed. (C) Composition of cells in each cluster. (D) Subclustering of macrophages showing four subsets. The intergroup differences are listed. (E) Subclustering of T cells showing six subsets. The intergroup differences are listed. (F) Correlations found between T cells and healing parameters. IB2 refers to Ifi202b+Plet1+Plk2+Krt6a+ inner bulge layer keratinocytes.
