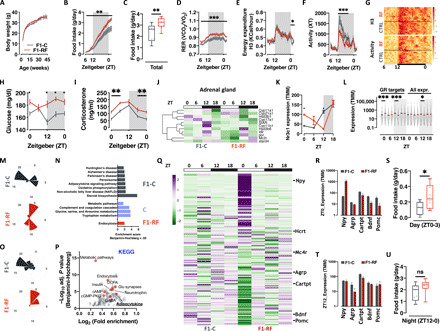
Fig. 2. Paternal circadian disruption reprograms offspring feeding behavior, metabolic health, and oscillatory transcription in liver and hypothalamus.

(A) Body weight trajectories. (B and C) Single animal cumulative food intake (B) and quantification of daily food intake (C). (D to G) Single animal respiratory exchange ratio (RER) (D), energy expenditure (E), locomotor activity (F), and their heatmap representation (G). (H and I) Daily oscillations in circulating glucose (H) and corticosterone (I) levels. (J) Heatmap of the expression of genes involved in adrenal corticosterone biosynthesis. (K) Liver RNA-seq–based Nr3c1 expression. (L) Liver RNA-seq analysis of GR target genes from publicly available GR Chip-seq datasets. (All expr., all expressed genes in the dataset.) (M to P) JTK_CYCLE analysis of liver (M) and (N) and hypothalamus (O) and (P) RNA-seq data (M) and (O). Radar plot presenting the circadian gene expression in liver (M) and hypothalamus (O). (N) KEGG pathway analysis of oscillating genes in liver from F1-C (gray bars), F1-RF (red bar), or both (blue bars) F1 groups. (P) KEGG pathway analysis of genes differentially expressed in the hypothalamus of F1 male mice at ZT0. (Q) Heatmap visualization of RNA-seq–based expression of neuropeptides in F1-C and F1-RF mice. (R to T) RNA-seq–based expression of selected differentially expressed neuropeptides in the hypothalamus at ZT0 (R) and ZT12 (T) (n = 3 biological replicates). (U) Quantification of average daily food intake around ZT0 (S) and during the night phase (U). Data from F1 male mice (n = 10 to 12 or n = 3 biological replicates/ZT for RNA-seq experiments). *P < 0.05, **P < 0.01, ***P < 0.001; two-way ANOVA mixed effect model, time × experimental group or two-tailed t test. ns, not significant; GABA, γ-aminobutyric acid; DCPA, Dopamine or Dihidroxphenylalanine; ccMP-PKG, cyclic-GMP (Guanine Mono Phosphate)-Protein Kinase G.
