
Fig. 8. TBRFA feature interaction network analysis.
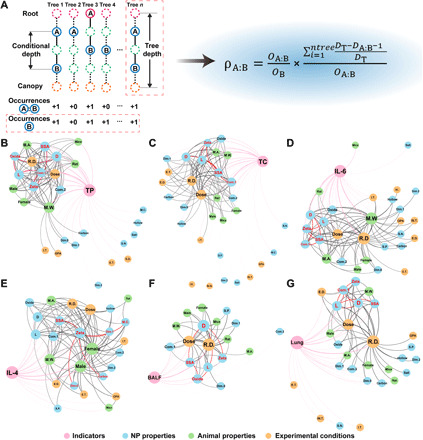
(A) TBRFA interaction coefficient calculation method. (B to G) Feature interaction networks for total proteins (B), total cells (C), IL-6 (D), IL-4 (E), BALF (F), and lung (G). Different colors are used to represent different types of features and indicators. The thickness of the lines represents the strength of the interaction. The size of the circle represents the number of times the feature interacts with other features. The five strongest interaction NP properties in the networks are highlighted in red.