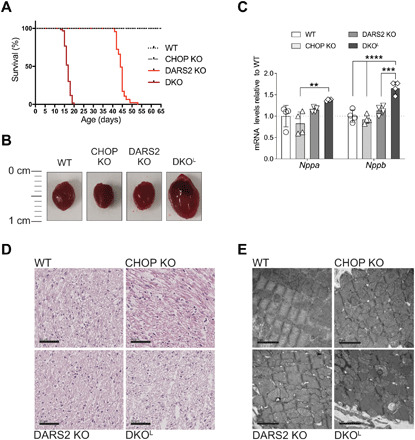
Fig. 1. Phenotypic characterization of DKO animals.

(A) Kaplan-Meyer survival curves for wild-type (WT; n = 36), CHOP KO (n = 35), DARS2 KO (n = 47), and DKO animals (n = 60). The life span of DKO in comparison to DARS2 KO mice is significantly decreased (P < 0.0001; log-rank test and Gehan-Breslow-Wilcoxon test). The viability of CHOP KO mice was WT-like in a 12-month follow-up. (B) Heart gross morphology. (C) Fold changes of the cardiac hypertrophy markers Nppa and Nppb obtained from the RNA sequencing dataset at P17 (±2) (n = 4). Bars represent means ± SD [multivariate analysis of variance (MANOVA) followed by one-way ANOVA and Tukey’s multiple comparisons test, **P < 0.05, ***P < 0.001, and ****P < 0.0001]. (D) H&E staining; (n = 3) at P17 (±2). Scale bars, 50 μm. (E) Transmission electron microscopy–based analyses of cardiac tissue biopsies; (n = 1) at P17 (±2). Scale bars, 2 μm.
