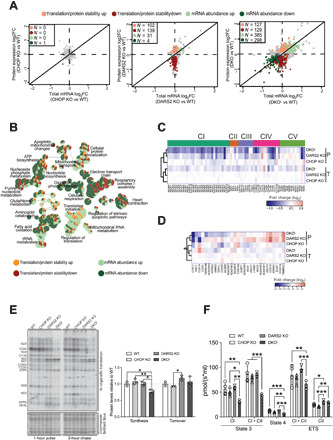
Fig. 2. Loss of Chop causes strong respiratory defects that can only partially be explained by an exacerbated defect in mitochondrial translation.

(A) Scatter plots of total mRNA and protein fold changes (FC) comparing CHOP KO, DARS2 KO, or DKOL to WT. The numbers of significantly regulated genes are indicated for translation/protein stability (red), and mRNA abundance (green). RNA sequencing and quantitative proteomics were performed on hearts of animals at P17 (±2) (n = 4). (B) A GO network of overrepresented terms among genes regulated via changes in translation/protein stability (up-regulated, light red; down-regulated, dark red) and mRNA abundance (up-regulated, light green; down-regulated, dark green) in DKO versus WT. Nodes represent identified GO terms, while the pie chart within each node indicates the proportion of genes regulated. (C and D) Heatmap of protein expression (P) and total mRNA (T) log2 fold changes of (C) the OXPHOS subunits grouped in respective complexes and (D) OXPHOS assembly factors (n = 4). (E) In organello translation assay (left) of cardiac mitochondria at P17 (±2). De novo protein synthesis was determined after 1 hour of 35S-methionine pulse labeling; protein turnover was assessed after 3 hours of the cold chase. Coomassie brilliant blue–stained gel was used as a loading control. Relative protein synthesis and turnover rates (right) (n = 3). (F) Oxygen consumption of intact cardiac mitochondria at P17 (±2). State 3: adenosine 5′-diphosphate (ADP)–stimulated respiration using CI or CI + CII substrates. State 4: Respiration upon addition of oligomycin. ETS, maximum respiration upon mitochondrial uncoupling (CI) and after addition of rotenone (CII) (n = 3 to 4). Bars represent means ± SD (MANOVA followed by one-way ANOVA and Tukey’s multiple comparisons test, *P < 0.05, **P < 0.01, and ***P < 0.001).
