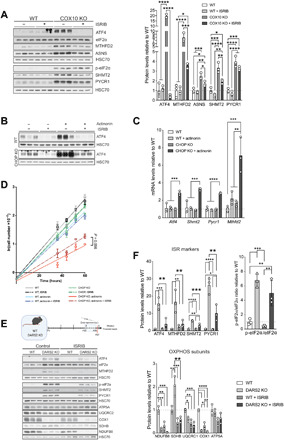
Fig. 4. Mitochondrial ISR has opposing effects depending on the levels of activation mediated by ATF4.

(A) Western blot analysis (left) and relative protein levels (right) of ISR markers and ATF4 downstream targets in immortalized COX10 KO and WT fibroblasts upon 48-hour treatment with DMSO (−) or ISRIB (+). (B) Western blot analysis of WT and CHOP KO MEFs treated for 48 hours with DMSO (−) or actinonin (+) in the presence (+) or absence (−) of ISRIB during the last 4 hours before protein isolation. (C) Relative transcript levels in WT and CHOP KO MEFs treated for 48 hours with DMSO (control) or actinonin. Tbp expression was used for normalization (n = 3). (D) Growth curves of respective exponential growth phases of WT and CHOP KO MEFs treated with DMSO (control), actinonin, and +/−ISRIB, respectively. Curves were determined using linear regression (n = 3). Bars represent means ± SD. (E) Western blot analysis of heart lysates from 4-week-old WT and DARS2 KO animals treated with control (DMSO) and ISRIB, according to the experimental setup presented in the schematic illustration (top). Animals are treated with daily injections of saline (control) or ISRIB solution for 7 days (blue boxes), starting at P19, and euthanized at P27 (red line) (n = 3). (F) Quantification of ISR markers (top), OXPHOS subunits (bottom), and p-eIF2α/eIF2α ratio (right) from the Western blot analysis at (E). (A, B, and F) Antibodies used were raised against proteins indicated in panels. HSC70 was used as a loading control. (A, C, and F) Bars represent means ± SD (MANOVA followed by one-way ANOVA and Tukey’s multiple comparisons test, *P < 0.05, **P < 0.01, ***P < 0.001, and ****P < 0.0001).
