
Fig. 5. Strong suppression of protein synthesis by overactivated ISR is beneficial but cannot be sustained in vivo leading to devastating consequences.
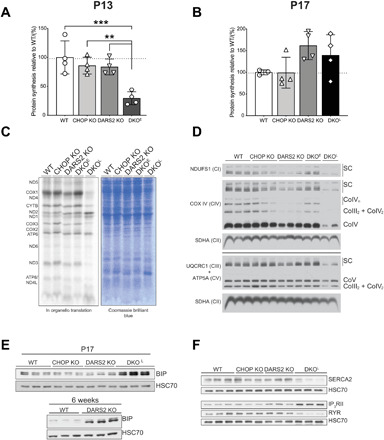
(A and B) The relative protein synthesis rate of animals injected with puromycin at (A) P13 and (B) P17. Bars represent means ± SD (one-way ANOVA and Tukey’s multiple comparisons test, **P < 0.01 and ***P < 0.001) (n = 4). (C) De novo synthesis in mitochondria isolated from WT, CHOP KO, DARS2 KO, and DKOE and DKOL animals after 1 hour of 35S-methionine pulse labeling followed by SDS-PAGE. Coomassie blue–stained gel was used as a loading control. (D) Blue native polyacrylamide gel electrophoresis (BN-PAGE) and subsequent Western blot analysis of OXPHOS complexes and supercomplexes in mitochondria isolated from WT, CHOP DO, DARS2 KO, and early (DKOE) and late-stage (DKOL) DKO animals. Subunit-specific antibodies (left) were used to detect respective complexes and supercomplexes (right) (n = 3). (E) Western blot analysis of BIP levels in WT, CHOP KO, DARS2 KO, and DKO at P17 (±2) (top) and WT and DARS2 KO at 6 weeks (bottom) (n = 3). (F) Western blot analysis proteins involved in the Ca2+ metabolism in WT, CHOP KO, DARS2 KO, and DKOL at P17 (±2) (n = 3). (E and F) HSC70 was used as a loading control (n = 3).