Figure 8.

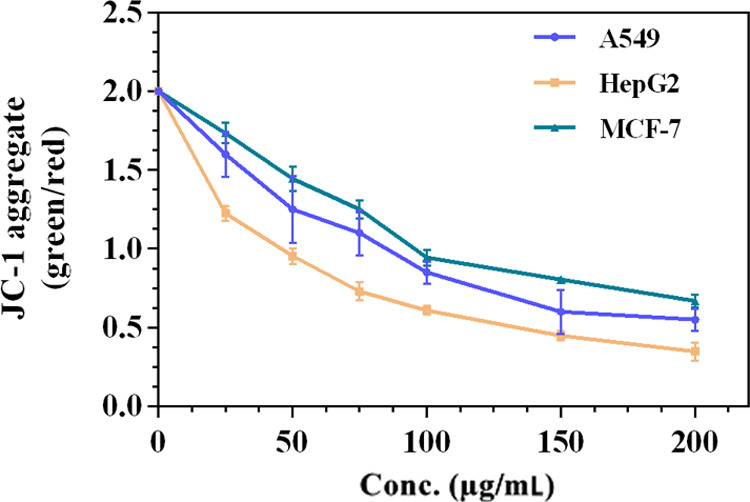
Loss of mitochondrial membrane potential after treatment of different concentrations of Cp-BSA nanospheres in different cancer cell lines detected by JC-1 staining and expressed as the ratio of green/red fluorescence intensity.

Loss of mitochondrial membrane potential after treatment of different concentrations of Cp-BSA nanospheres in different cancer cell lines detected by JC-1 staining and expressed as the ratio of green/red fluorescence intensity.