
Fig 2: Dose-dependent Treg activation in T1D patients treated by ld-IL-2.
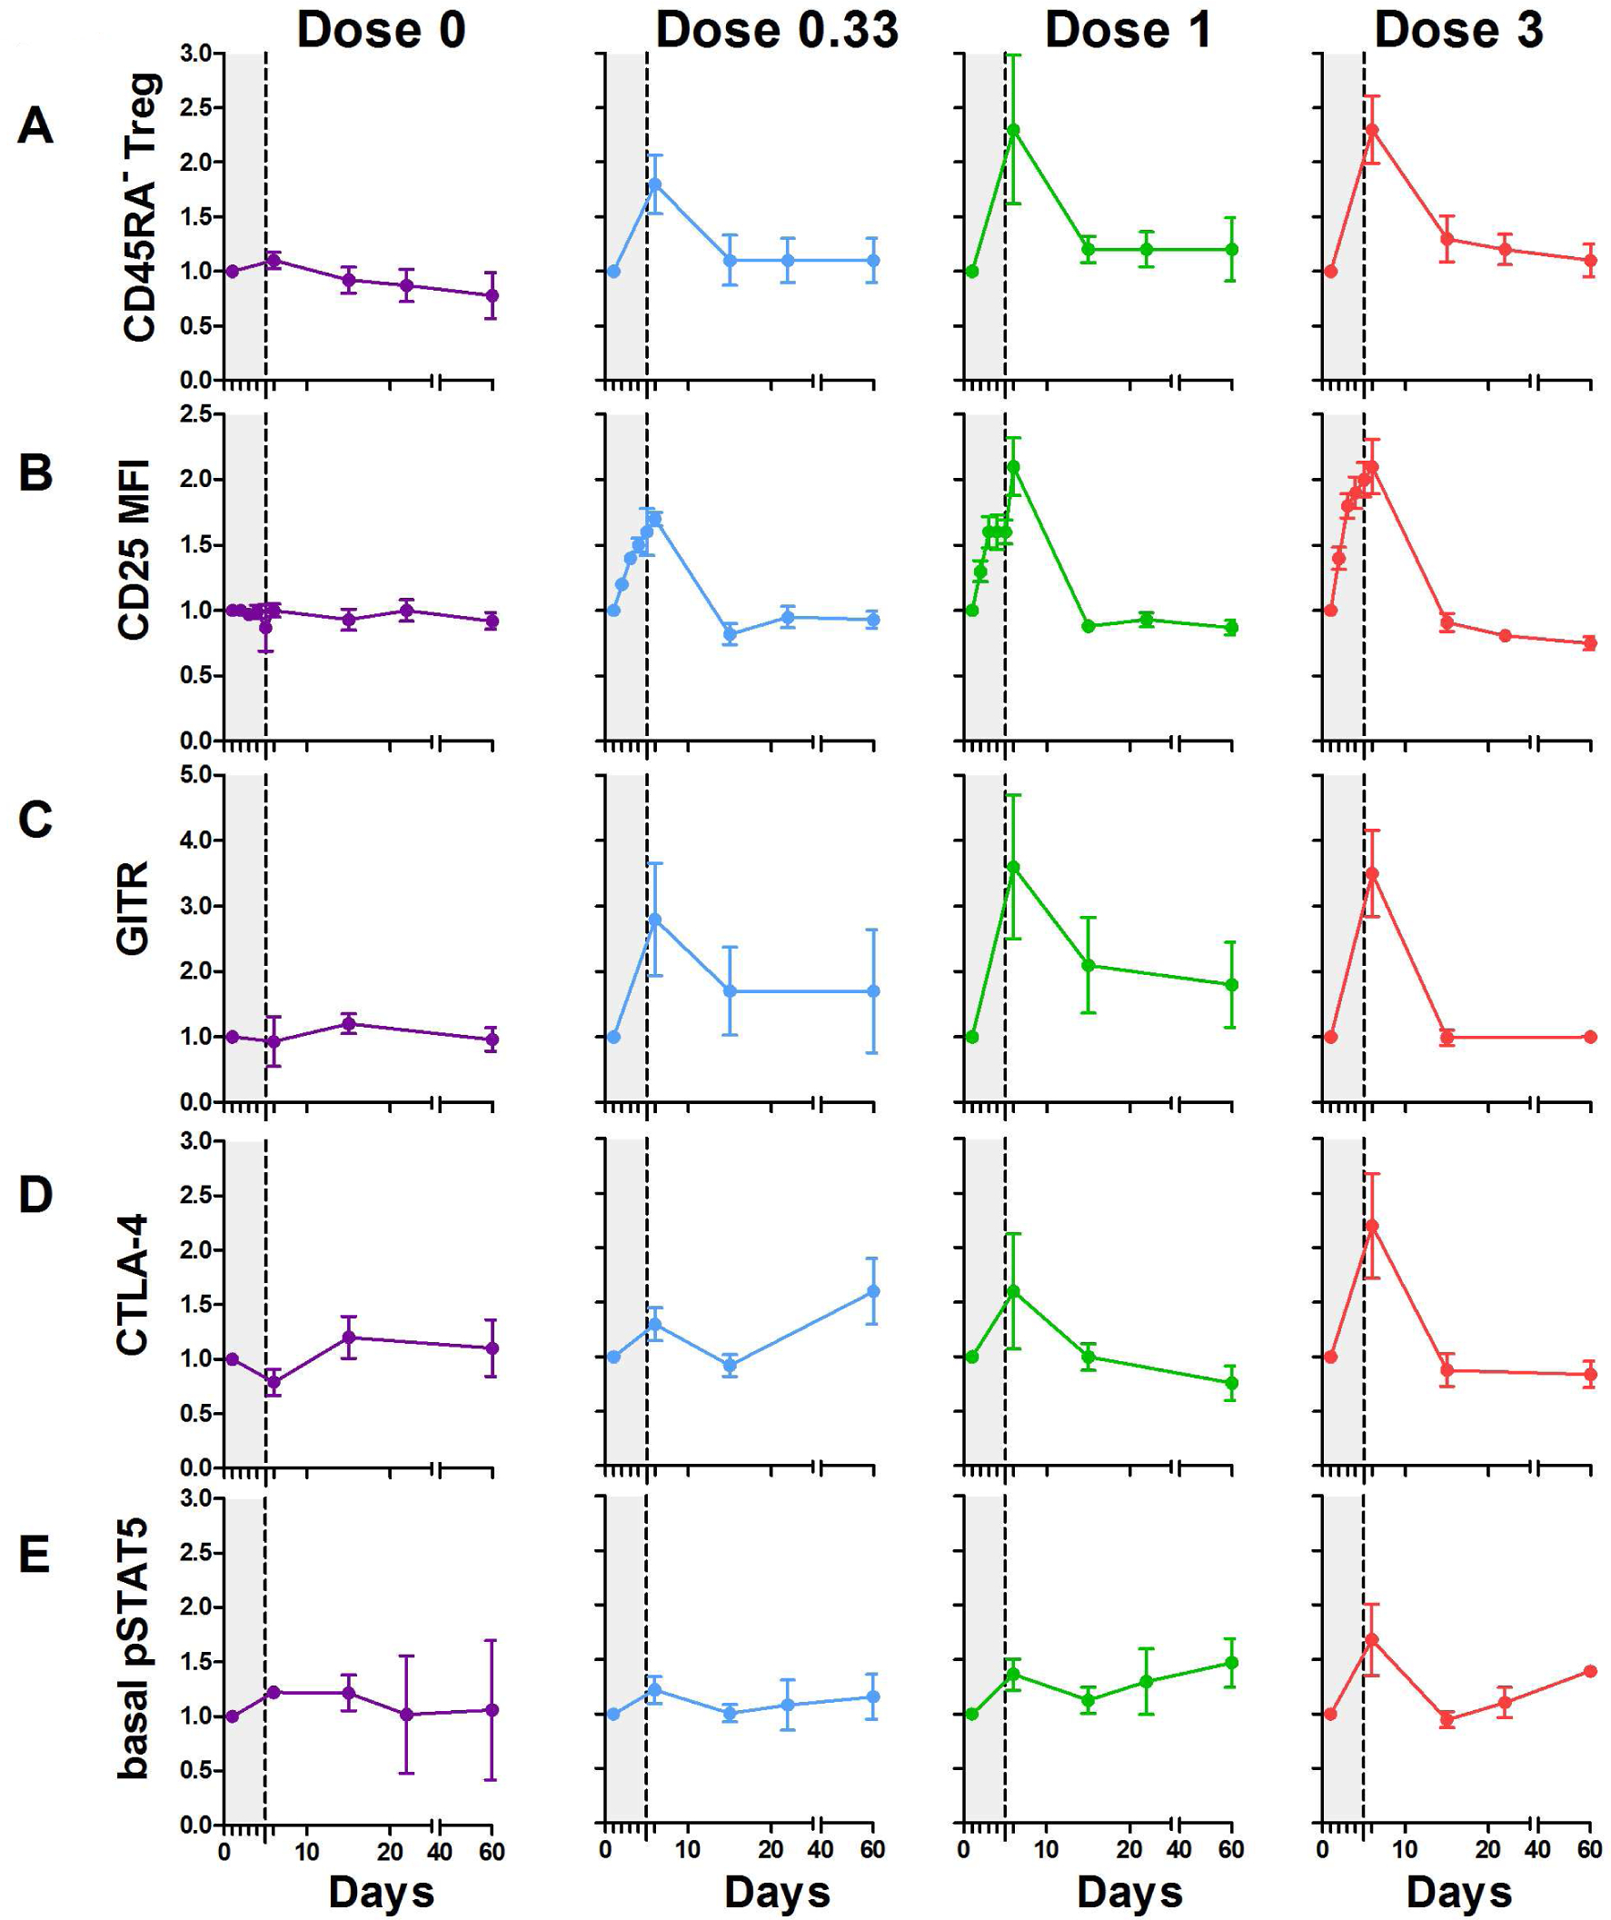
Curves represent changes in Treg activation markers. Percentage of CD25highCD127− CD45RA− Tregs among CD4+ cells (A). CD25 MFI (B), percentage of GITR+ (C), CTLA-4+ (D) and basal pSTAT5 expression (E) in CD4+CD25highCD127−Foxp3+Tregs. Data are shown as mean ± SEM of patients’ values normalized by individual baseline values at different time points (the grey zone represents the 5 days IL-2 treatment). Results are for all 6 patients per group, except for pSTAT5 measurement for which 2, 3, 3 and 3 patients were studied for the 0, .33, 1 and 3 MIU doses, respectively.