
Fig 5: Clustering of significantly regulated molecular signatures from PBMCs.
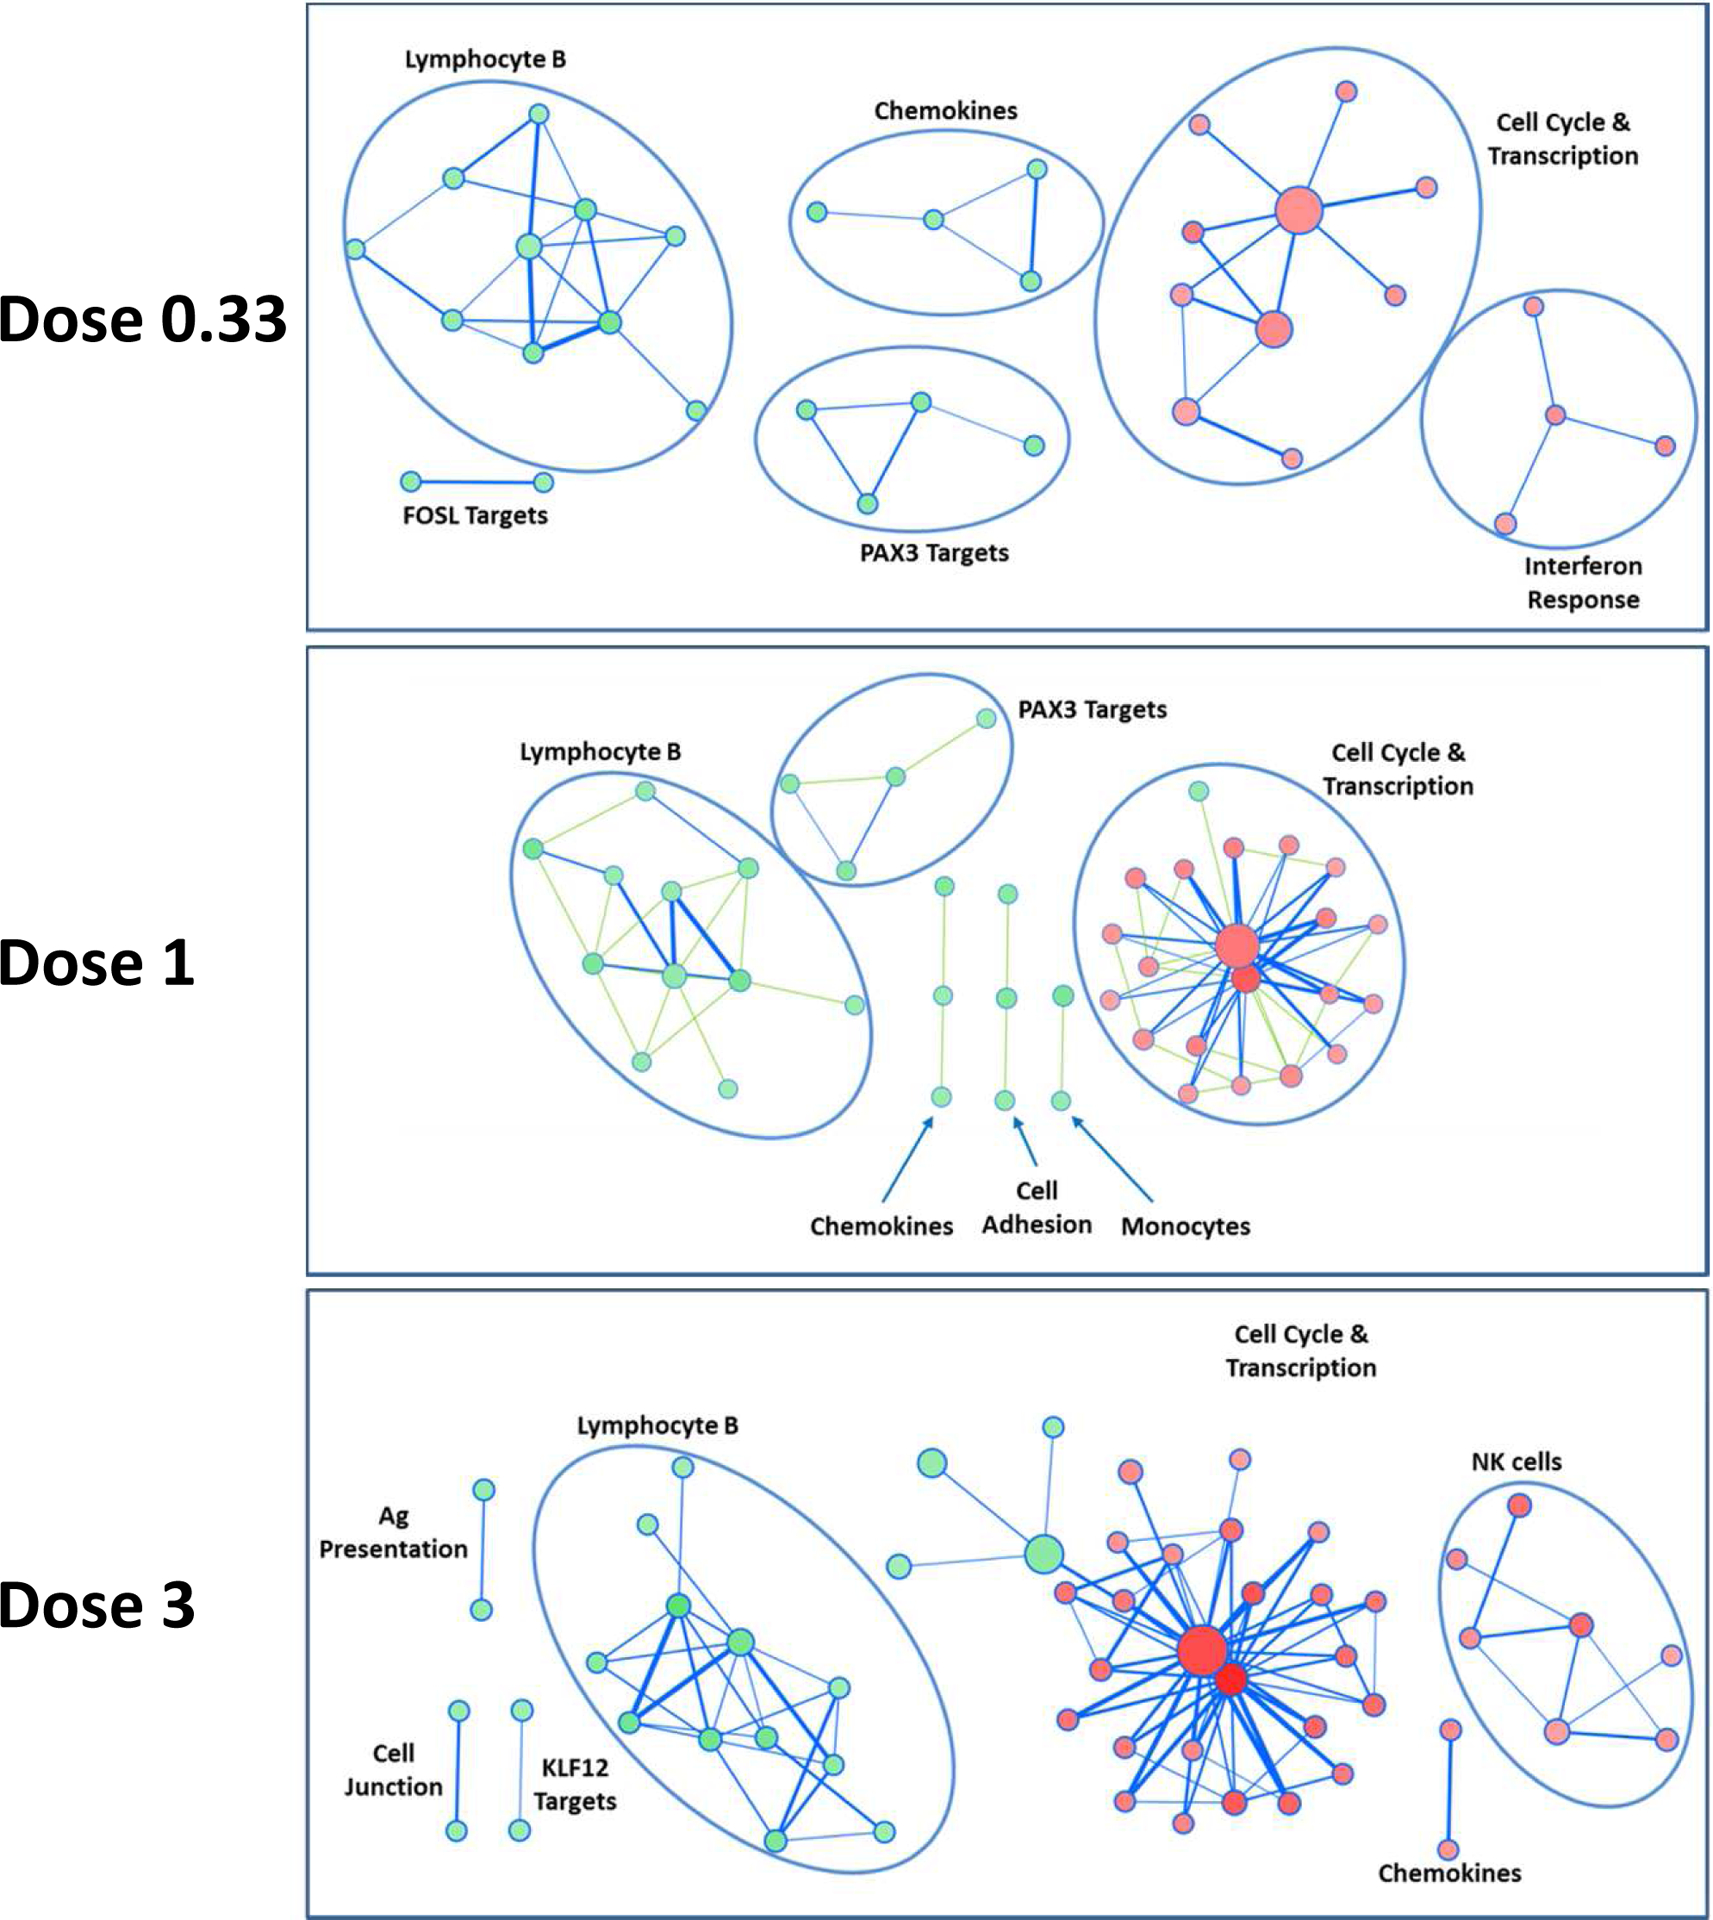
For each IL-2 treatment dose (0.33, 1 and 3 MIU), Enrichment Map analysis was performed on significantly up- and down-regulated molecular signatures, in red and green, respectively (q-value < 0.05). Clusters have been labelled according to their main biological feature. Size of nodes (circles) is proportional to the number of genes in the signature; width of bars linking nodes is related to the Jaccard coefficient between two signatures. Signatures without connection are not shown.