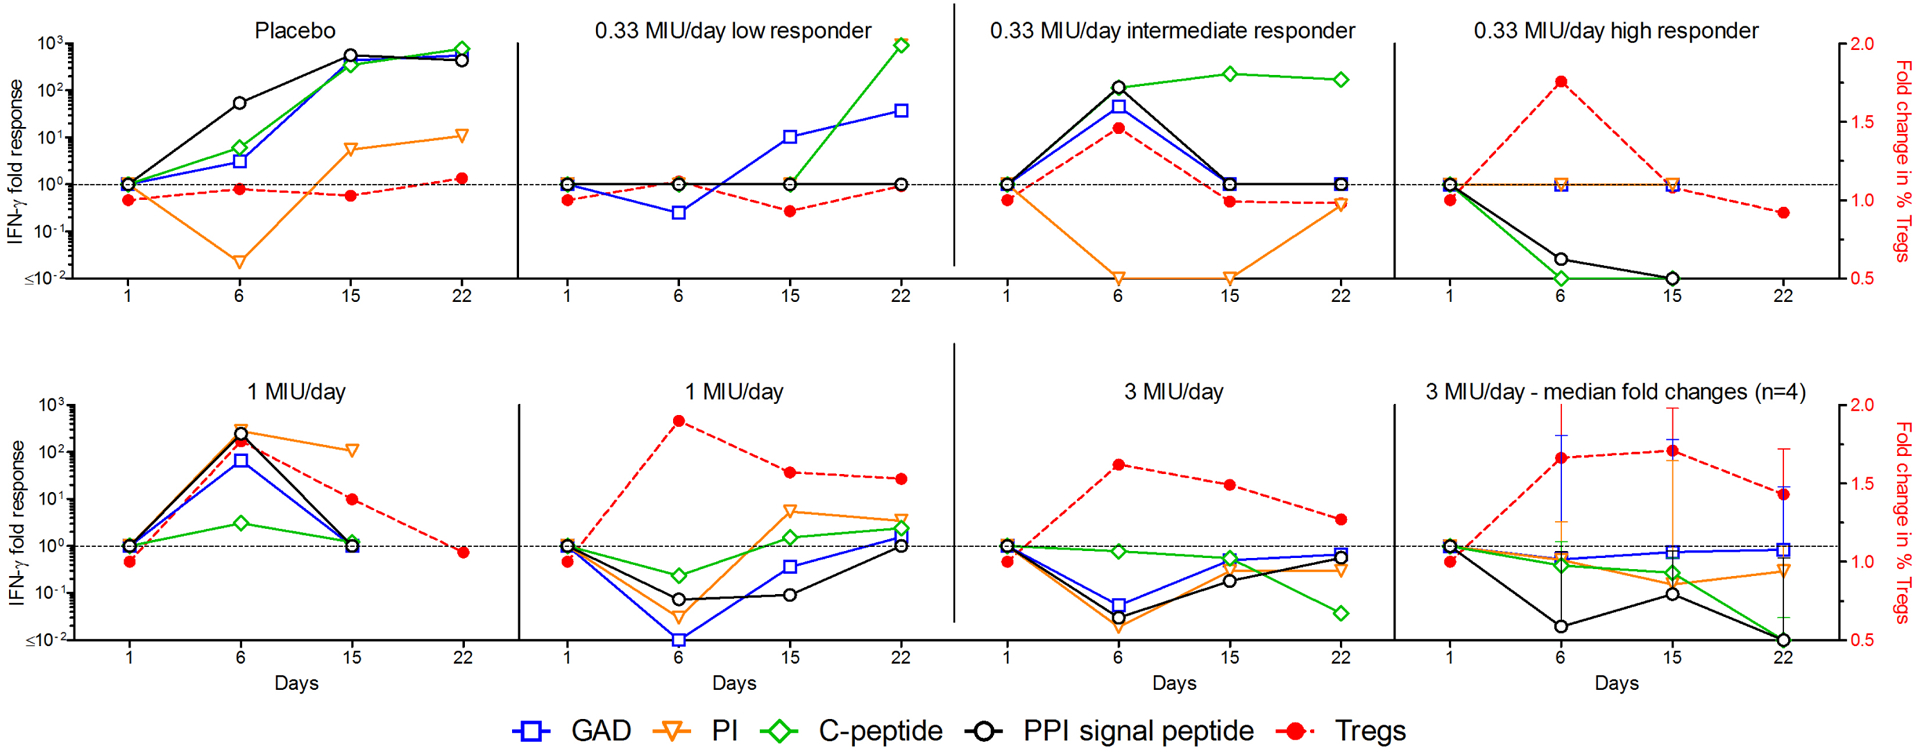
Fig 6: Modifications of β-cell-specific T-cell responses and Treg numbers in ld-IL-2-treated T1D patients.

PBMCs from T1D patients were analyzed for IFN-PBMCs from T1D patients were analyzed for IFN-γ T-cell responses against β-cell protein antigens (left Y axis) at different time points. Percentages of Tregs are shown by the dashed red line (right Y axis). Results are expressed as fold changes normalized to day 1 (baseline). Each graph represents one patient except the bottom right graph which represents the median and range fold changes of 4 patients treated at 3 MIU /day.
