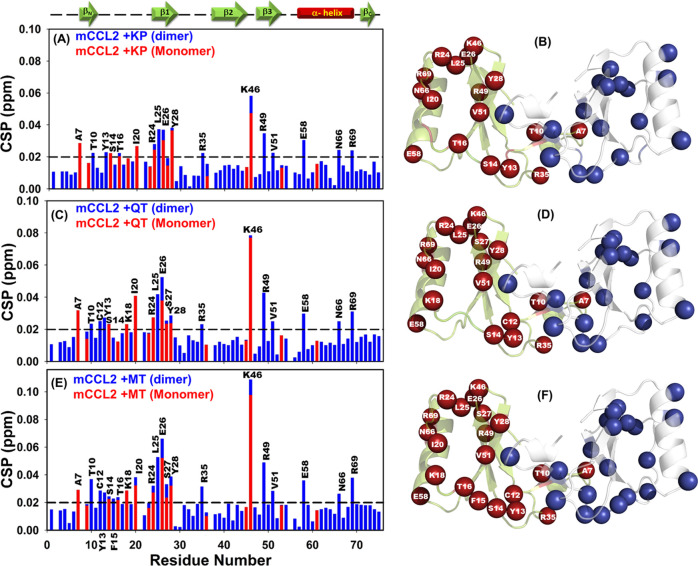
Figure 4.
1H–15N HSQC chemical shift perturbation (CSP) analysis of mCCL2–flavonol interactions. CSP histograms of (A) mCCL2–KP, (C) mCCL2–QT, and (E) mCCL2–MT complexes. The representative secondary structural features are presented on the top of CSP plot(s), and the horizontally dashed black line depicts the cutoff value. Residues exhibiting significant KP-induced (B), QT-induced (D), and MT-induced (F) perturbations are presented by spheres on the mCCL2 dimer and are marked only on one subunit.

