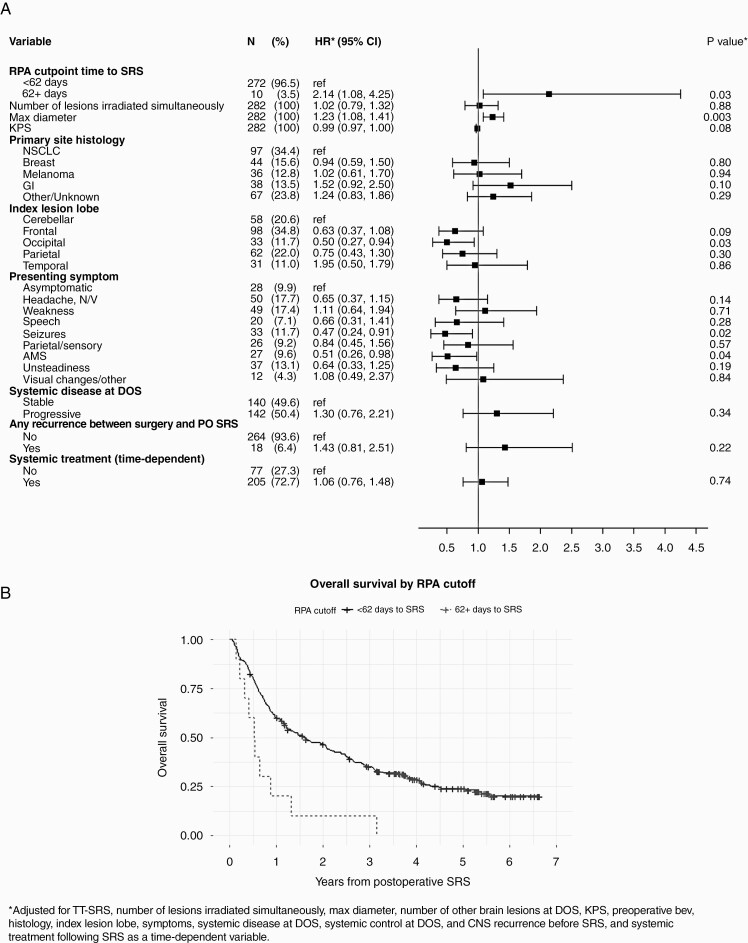
Figure 2.
(A) Forest plot demonstrating hazard ratios for multivariable analysis of patient factors with overall survival (OS). (B) Kaplan-Meier curve of OS stratified by time to SRS using the RPA cutpoint of 62 days. Abbreviations: TT-SRS, time to SRS; RPA, recursive partitioning analysis; KPS, Karnofsky Performance Status; NSCLC, non-small cell lung cancer; GI, gastrointestinal; N/V, nausea/vomiting; AMS, altered mental status; DOS, date of surgery; PO, postoperative.

