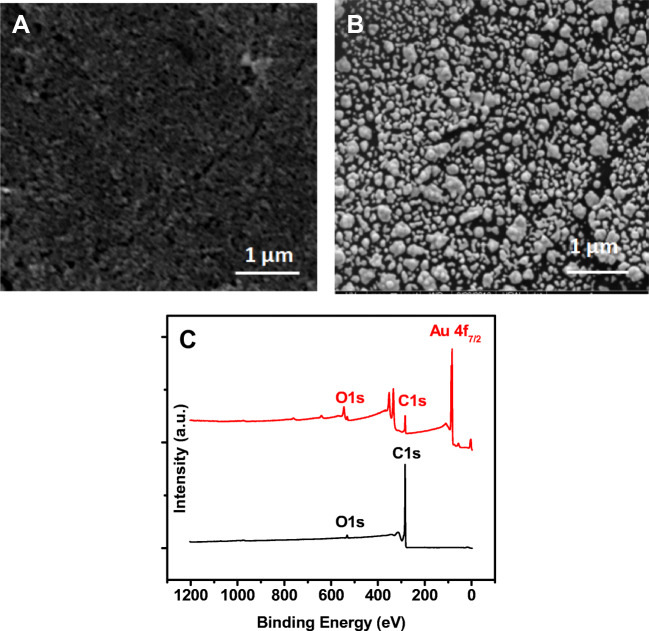
Fig. 1.
Images of the electrodes by scanning electron microscopy (SEM) for the bare carbon before (a) and after deposition of gold nanoparticles using 10 CV scans (b). The SEM measurements were done using an acceleration voltage of 5 kV, magnification = 50,000× and a working distance of 4.8 mm. c XPS survey spectra of the bare carbon (black) and gold nanoparticles-modified electrodes (red line)

