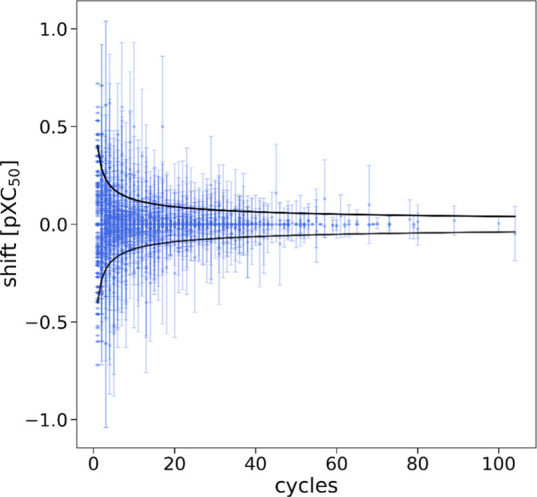
Figure 5.

Additivity shift per compound for the DRD2 dataset for illustration of the results summarized in Table 5. Shown is the average additivity shift per compound and the standard deviation of the shift. Black lines indicate the 95% CI for a perfectly additive dataset with an experimental uncertainty of σ = 0.1 log unit.
