
Figure 2.
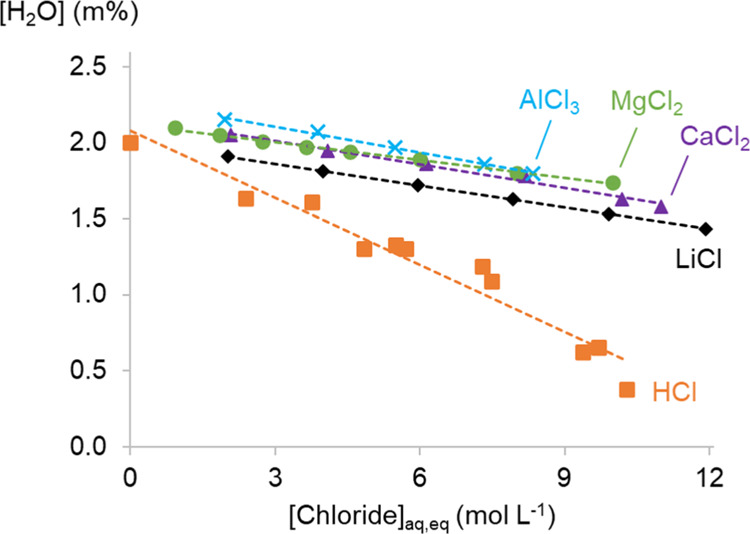
Water content of the organic phase comprising 0.2 mol L–1 TOMAC in toluene for different chloride salts in the aqueous phase. The x-axis shows the total chloride concentration at equilibrium in the aqueous phase. Linear fits were added to increase the readability.