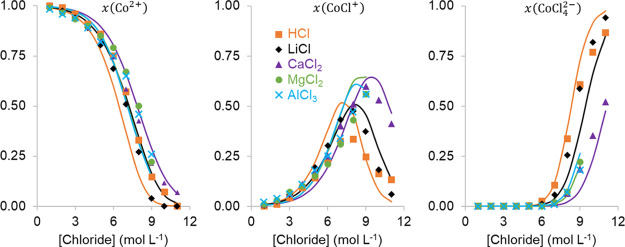
Figure 6.
Speciation of Co(II) in different aqueous chloride solutions expressed as the mole ratio (x) of each species to the total Co(II) content. The x-axis shows the total chloride concentration. The full lines represent the model calculations, while the points are experimental data from our previous papers.25,26

