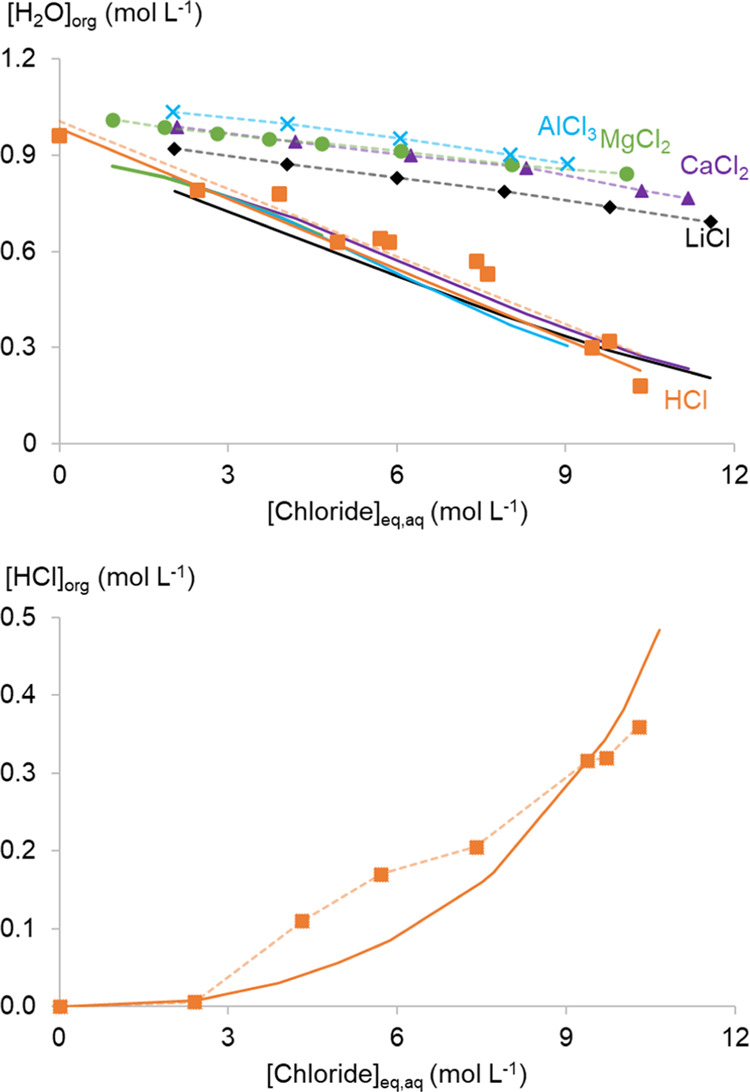
Figure 7.

Top: water content of the organic phase comprising 0.2 mol L–1 TOMAC in toluene at equilibrium with different aqueous chloride salt/HCl solutions. Bottom: a similar graph with the HCl concentration of an organic phase in equilibrium with HCl solutions. The full lines represent the model calculations, while the points are experimental data.
