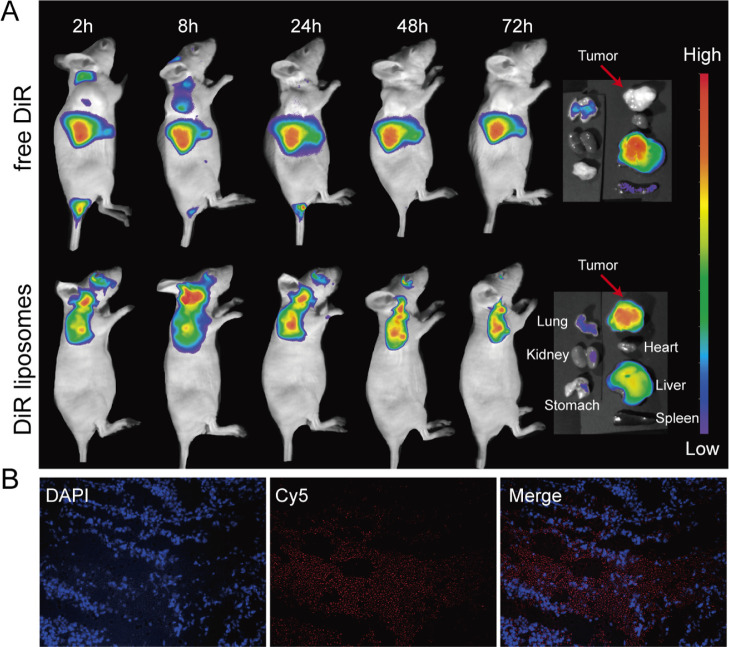
Figure 5.
Distribution of liposomes in the mouse subcutaneous xenograft model. (A) Fluorescence images of mice demonstrated that only a small amount of the drug was observed in the tumor site at 2 h and 8 h in the free DiR group. However, fluorescence was clearly observed in the tumor sites at 2, 8, 24, 48, and 72 h in the DiR liposome group. From the right to left and from the top to bottom, the fluorescence images of the tumors, hearts, livers, spleens, lungs, kidneys, and stomachs on the far right show that the fluorescence in the DiR liposome group was mainly focused at the tumor site. (B) Fluorescence images of frozen tumor slices at 24 h after the injection of cy5-miR-7 liposomes. The blue fluorescence represents the nucleus after 4′,6-diamidino-2-phenylindole (DAPI) staining; the red fluorescence represents cy5-miR-7.

