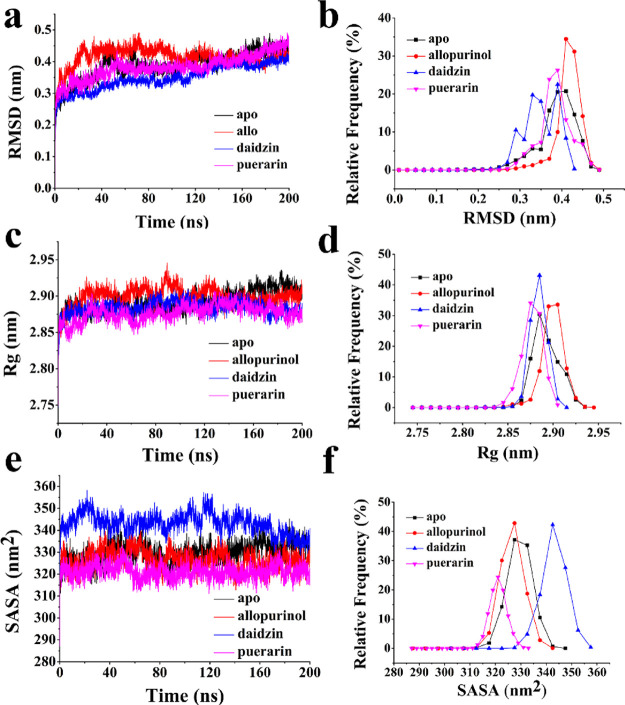
Figure 3.
(a) RMSD for the backbone atoms and (b) the corresponding frequency of the four systems. (c) Radius of gyration (Rg) plot and (d) its corresponding frequency. (e) Average SASA plot and (f) its corresponding frequency. The free XO is represented in red, XO-allopurinol is represented in black, XO-daidzin is represented in blue, and XO-puerarin is represented in pink.

