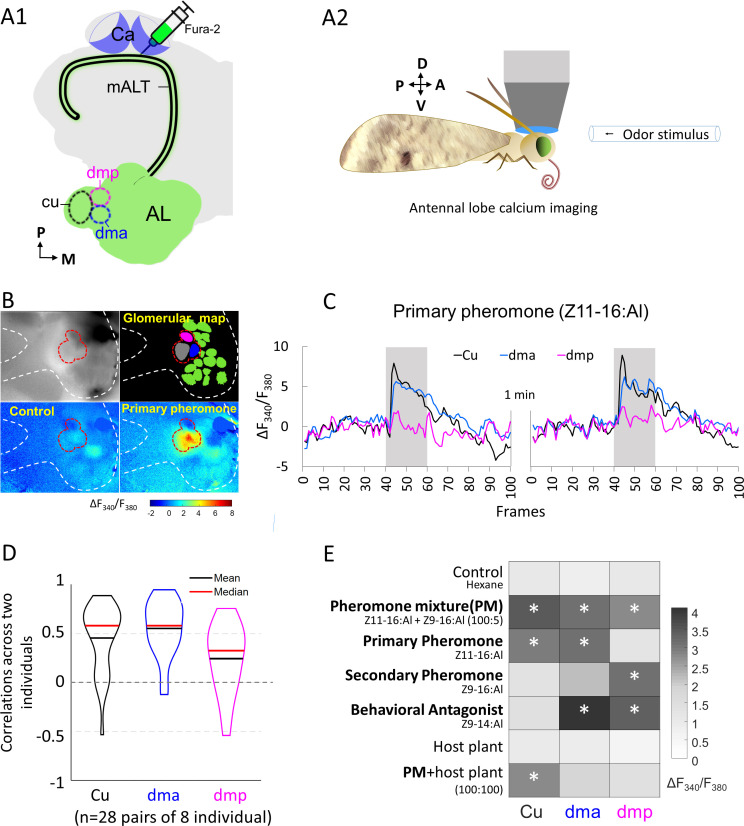
Figure 2. Macroglomerular complex (MGC) neurons confined to the medial antennal-lobe tract (mALT) and their odor responses during calcium imaging.
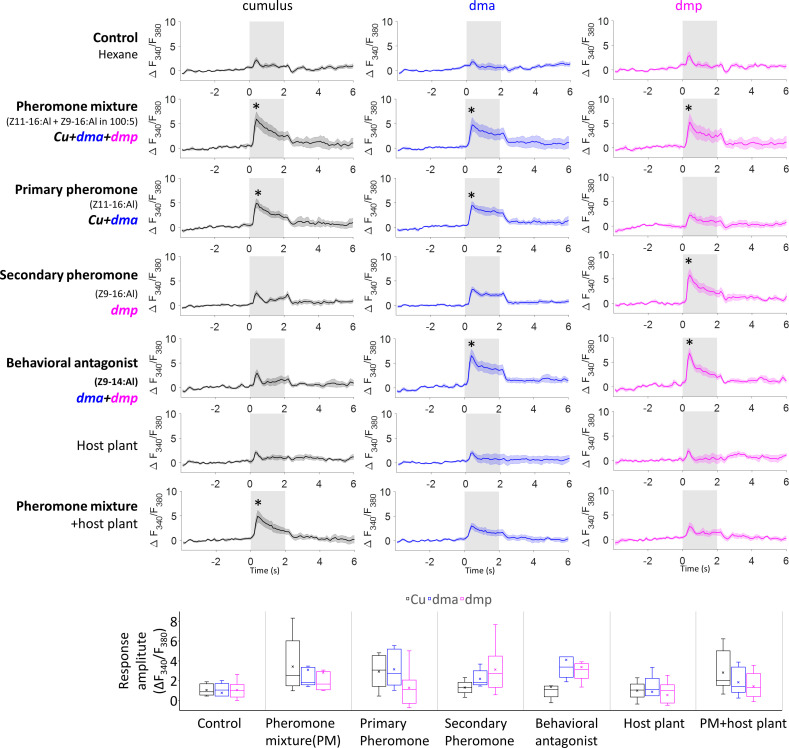
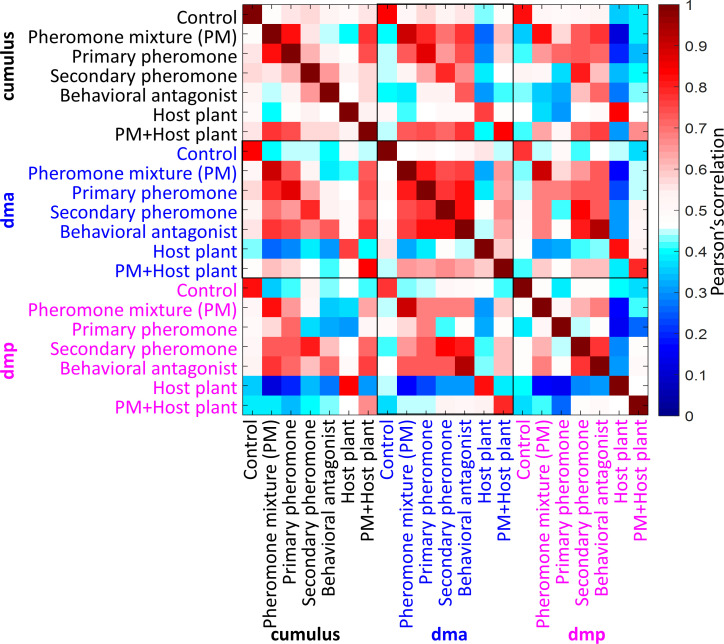
(A1) Illustration of the retrograde staining with the calcium indicator (Fura-2) from calyx (Ca) labeling a population of the antennal lobe (AL) output neurons exclusively confined to the mALT, including the mALT MGC neurons. (A2) Schematic showing the placement of the moth during calcium imaging providing dorsal orientation of the brain. (B) Characteristic examples of calcium imaging data on MGC: top left, image of an AL stained with Fura from the Ca; top right, a processed image showing a map of recognized glomeruli; down left and down right, heat maps of responses to the control and primary pheromone, respectively. Dashed white and red lines mark the AL and the MGC region, respectively. (C) Calcium signal rises in response to the primary pheromone in neurons innervating distinct MGC units. An average baseline activity, that is, the Fura signal representing the ratio between 340 and 380 nm excitation light (F340/F380) from 0.5 to 2.5 s (frames 5–25, within 4 s spontaneous activity) was selected and set to zero. The trace of neuronal activity, specified as ΔF340/F380, illustrates the changes in fluorescent level in two repeated stimulations with 100 ms sampling frequency. The interval between stimulations was 1 min. Gray bar, the duration of the stimulation period (2 s). (D) Violin plot of consistent tests across eight individuals. (E) Mean response amplitudes of a population of PNs innervating the same MGC units to all presented stimuli (n = 8), where * indicates a significant response compared with control. Box plots of the response amplitudes are shown in Figure 2—figure supplement 1. Cu, cumulus; dma, dorsomedial anterior unit; dmp, dorsomedial posterior unit.


