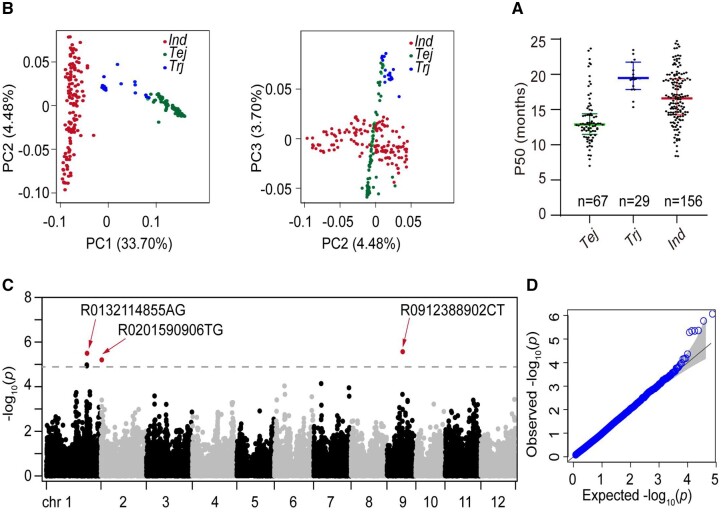
Figure 1.
Variation in seed storability in a panel of rice germplasm. A, Difference in seed storability assayed by P50 (the time for germination percentage to decrease to 50%) among three subgroups. The edges represent the range of the 25th to 75th percentiles with the mean value shown by a bold middle line. Ind, indica; Tej, temperate japonica; Trj, tropical japonica, n represents the number of accessions. B, PC analysis of 252 rice accessions classifying three rice subgroups based on the high-density SNP markers. The proportion of variance explained by the first three PCs is indicated in the axis labels. C, Manhattan plot depicting significant SNPs associated with seed storability in the rice germplasm panel. The x-axis represents SNP locations across 12 chromosomes, and the y-axis indicates the −log10 (P-value) of the SNP association. The leading peaks are highlighted. The dotted line indicates the significance threshold after correction for multiple testing. D, Quantile–Quantile plot for the mixed-linear model analysis

