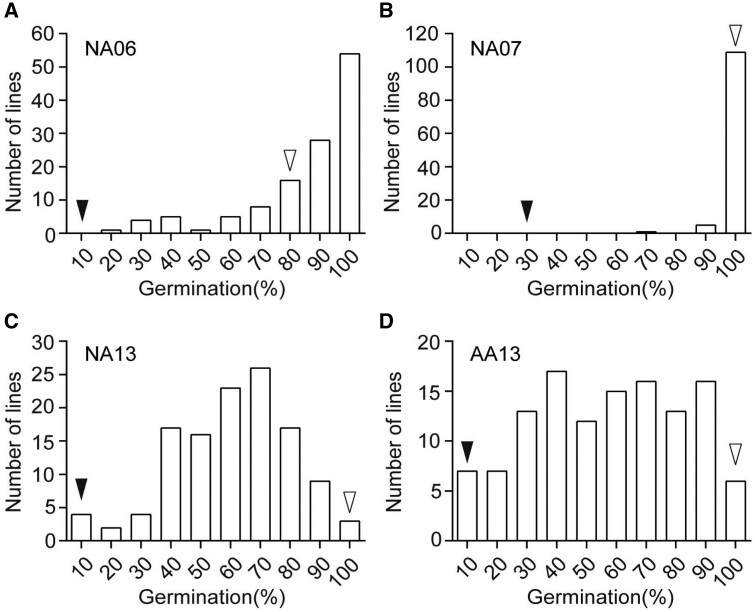
Figure 2.
Frequency distribution of seed germination percentage of the 9311/NIP CSSL population. Germination percentage of the seeds produced in 2006 (A), 2007 (B), and 2013 (C), under NA. The seeds produced in 2013 (D) under AA. Black and white arrowheads indicate the average seed germination percentage of NIP and 9311, respectively

