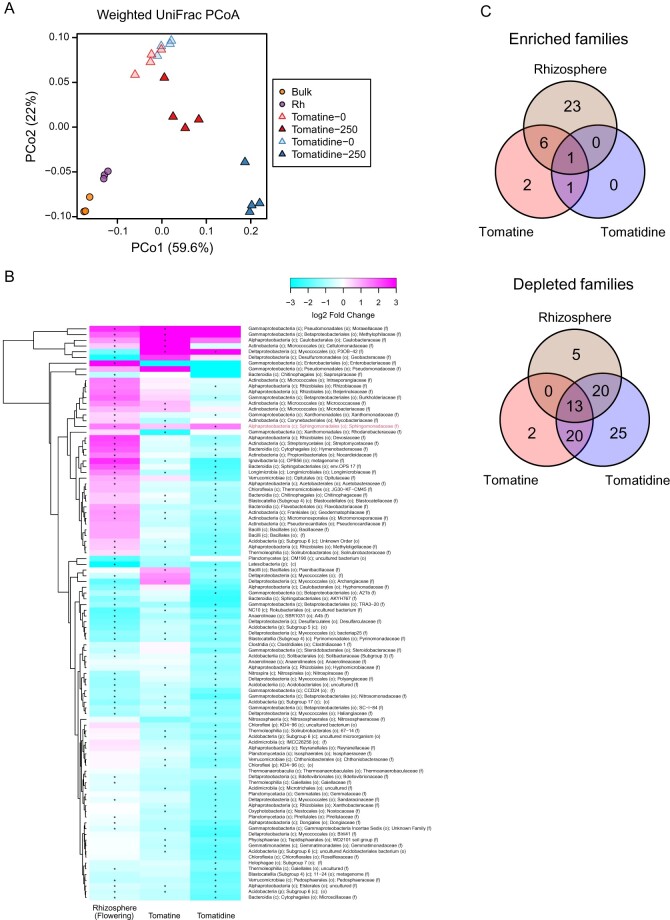
Figure 5.
Comparison of the bacterial communities in tomatine- and tomatidine-treated soil with those in the soil from the fields with tomato plants at the flowering stage. A, Results of the weighted UniFrac-based PCoA. B, Clustered heatmaps of the relative abundances of bacterial families (the mean of all samples >0.1%). The color of the heatmaps indicate log2 fold changes; teal denotes −3 while dark pink denotes 3. Asterisks indicate statistically significant differences in tomatine- and tomatidine-treated soils and tomato rhizosphere soil using LEfSe (an adjusted P-value < 0.05). Red letter indicates consistently enriched taxa. C, Venn diagrams to illustrate the overlap of enriched or depleted bacterial families in tomatine- and tomatidine-treated soil and rhizosphere soil. The numbers of bacterial families are shown in the circles. c, class; f, family; o, order; p, phylum; Rh, rhizosphere.

