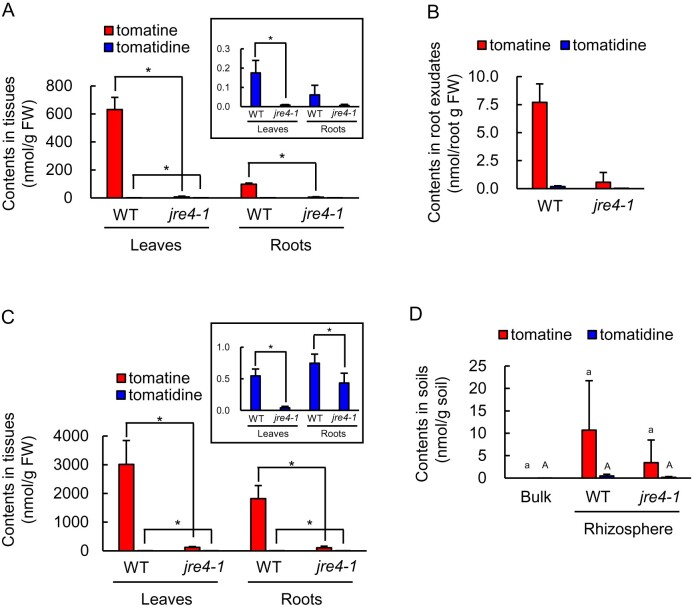
Figure 6.
Metabolite concentrations in tissue and soil samples of WT and jre4-1 tomato plants grown in hydroponic and field conditions. The content of tomatine and tomatidine in (A) leaves and roots and (B) root exudates of hydroponically grown WT and jre4-1 plants at the flowering stage. The concentration of tomatine and tomatidine in (C) leaves and roots and (D) bulk and rhizosphere soil of field-grown WT and jre4-1 plants at the flowering stage. Error bars indicate standard deviation in A, B, C (roots of jre4-1), and D, n = 3; C (leaves of WT and jre4-1 and roots of WT), n = 4. Asterisks indicate statistically significant differences (P < 0.05) by Student’s t test. Different letters (a–c for tomatine; A–C for tomatidine) indicate statistically significant differences (P < 0.05) for the contents of tomatine and tomatidine, respectively, by Tukey’s test. Rh, Rhizosphere.

