Figure 1.
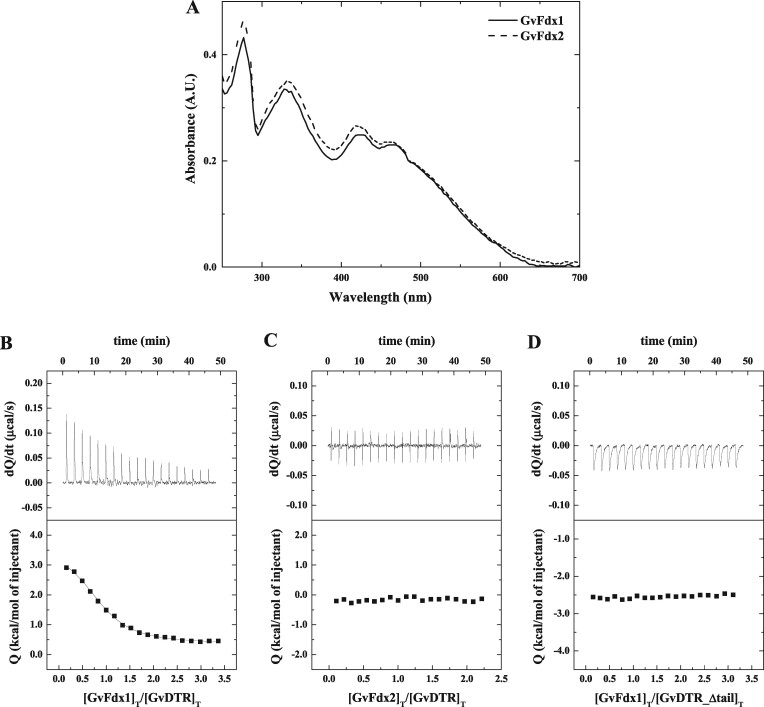
Binding affinity measurements for the interaction between Gloeobacter Fdxs and GvDTR by ITC. A, Absorption spectra of purified GvFdx1 (continuous line) and GvFdx2 (dashed line) in buffer 20-mM Tris-HCl, pH 7.6, 150-mM NaCl at 25°C. In the 300–600 nm region, the UV–visible spectra of the proteins are dominated by bands centered at about 330, 420, and 463 nm. B–D, Calorimetric assays for the binding of GvFdx1 to GvDTR (B), GvFdx2 to GvDTR (C), and GvFdx1 to GvDTR_Δtail (D). The upper plots show the thermograms corresponding to raw data of heat power associated with the sequential addition of the Fdxs solutions to the GvDTR or GvDTR_Δtail protein solutions. The lower parts are the binding isotherms (Fdx-normalized integrated heats per injection as a function of the molar ratio [(Fdx)Total/(GvDTR)Total]. Nonlinear least-squares regression employing a model with a single ligand-binding site per GvDTR monomer provided a dissociation constant, Kd, of 3.9 µM for the interaction of Fdx1 with GvDTR. No interaction was observed in the case of Fdx2 titrated into GvDTR or for Fdx1 titrated into GvDTR_Δtail.

