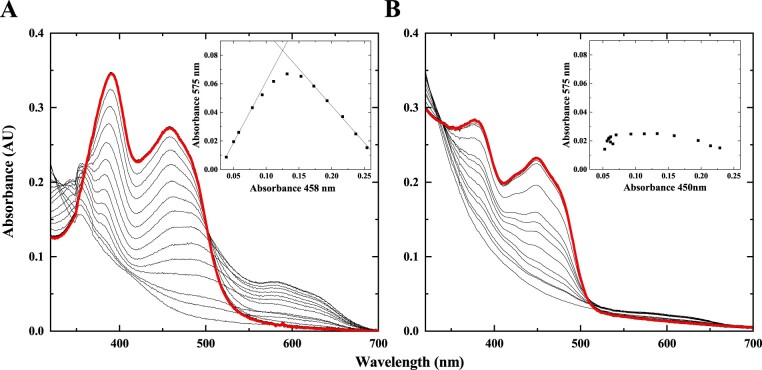
Figure 3.
Flavin spectral evolution for the photoreduction of GvDTR and GvDTR_Δtail. A, Absorption spectrum of oxidized flavin in GvDTR shows maxima of bands II and I at 391 and 458 nm, respectively. Flavin reduction occurs with neutral semiquinone stabilization as shown by the appearance of isosbestic points at 361 and 502 nm (for oxidized/semiquinone transition), and 324 nm (for semiquinone/hydroquinone transition). B, Reduction of oxidized flavin in GvDTR_Δtail (with maxima at 380 and 450 nm) occurs without semiquinone stabilization as shown by the isosbestic points at 340 and 509 nm for the oxidized/hydroquinone transition. The red bold lines show the spectra after one cycle of full protein photoreduction followed by molecular oxygen reoxidation, which is identical to the initial spectra. The insets show the absorption at the neutral semiquinone band maximum (575 nm) relative to absorption at the flavin band I maximum (450 nm) along with photoreduction. Experiments were performed under anaerobic conditions in the presence of 5-deazariboflavin and EDTA.

