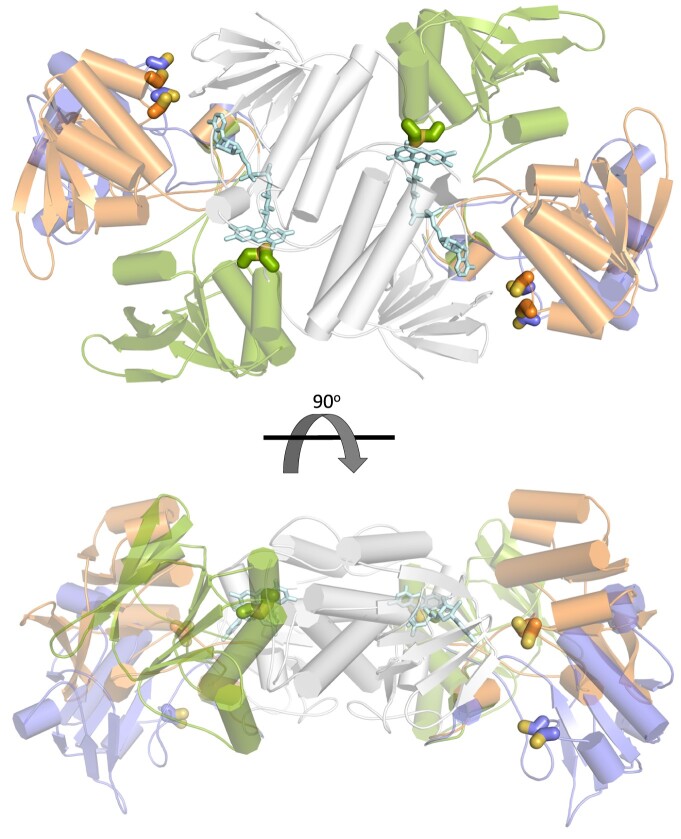
Figure 6.
Conformations adopted by GvDTR during its catalytic cycle. The structures are displayed in ribbons representation, with alpha-helices shown as cylinders and beta-strands as arrows. Cysteine residues of the CxxC motif (in CPK coloring) and the FAD cofactor (light blue) are represented as sticks. The three conformations are superimposed based on the structural alignment of the FAD-binding domain (grey). The structure shown in orange color represents the resting state of the enzyme (PDB codes: 6XTF, this work, and 5J60 (Buey et al., 2017b); states ii–iii in Figure 5; in green, the S-S of the CxxC motif in the redox-active disulfide domain is interacting with the flavin cofactor (state iv in Figure 5). This structure has been obtained by homology modeling using the flavin-oxidizing conformation of NTR from Escherichia coli as template (PDB code 1TRB; Kuriyan et al., 1991); the structure in blue represents the conformation of the enzyme for Trx binding (state v in Figure 5). This conformation has been modeled using the structure of the CaFFTR2:CaTrx2 complex as template (PDB code 6GND; Buey et al., 2018).

