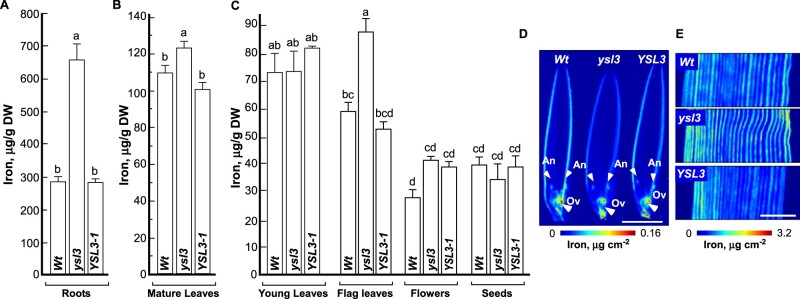
Figure 11.
The ysl3 mutant accumulates more iron in roots, mature and flag leaves and flowers. (A–C) Results from ICP-MS analysis of iron accumulation in the indicated tissues of the indicated plant lines grown as described in legend to Fig. 8. Shown values are arithmetic means ± S.E (n = 3 independent experiments). Levels not connected by the same letter are significantly different (p < 0.05, Tukey–Kramer HSD test). SXRF-based analysis of the spatial distribution of iron in flowers (D) and the middle part of the flag leaf (E). White arrows in (D) point to anthers (An) and ovaries (Ov). Scale bar = 2 mm. Wt, wild-type; ysl3, the ysl3-3 mutant; YSL3-1, the ysl3-3 mutant expressing the YSL3 cDNA; DW, dry weight.

