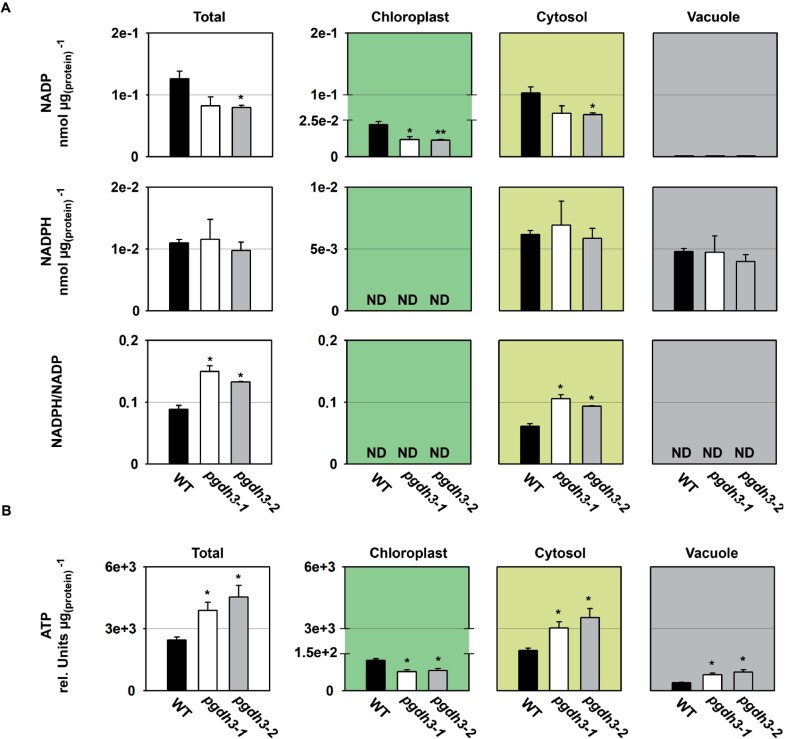
Figure 7.
Cellular and subcellular content of NADP(H) and ATP. The cellular and subcellular content of (A) NADP(H) and (B) ATP is shown in WT and pgdh3 mutants. Data presented are means (±se, n = 4). Asterisks indicate significantly different values between WT and pgdh3 mutant lines by the Student’s t test (*p < 0.05; **p < 0.01). ND = not detectable.

