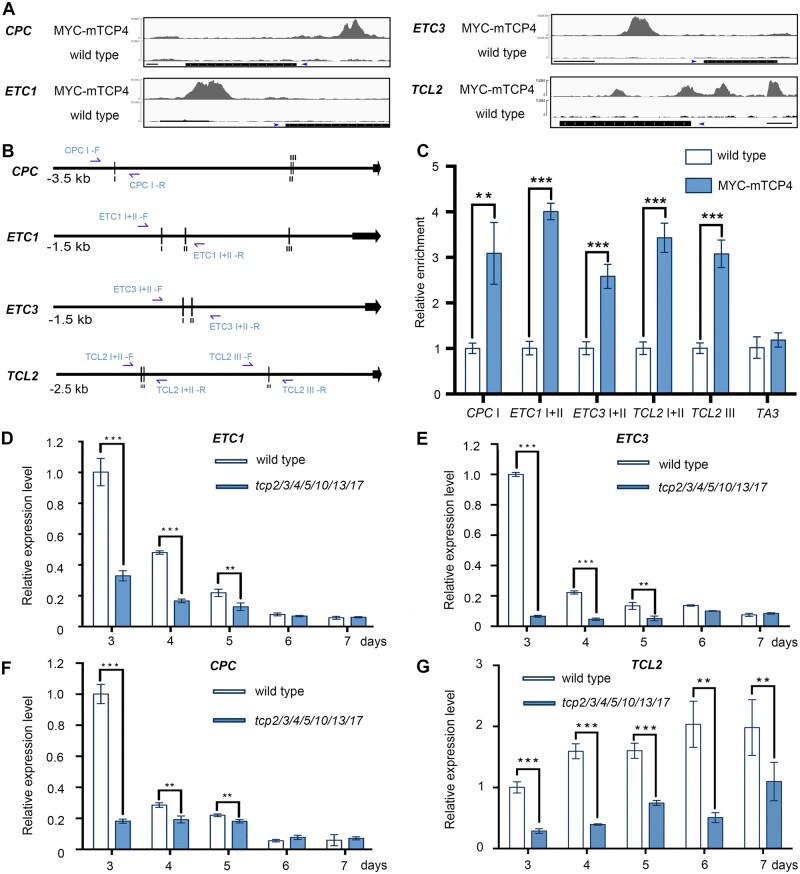
Figure 5.
TCPs directly promote the expression levels of R3 MYB genes. A, Peak graphs showing the ChIP-seq raw reads at the potential TCP4-bound gene loci using 4-d-old dark-grown wild-type and 35S-Myc-mTCP4 seedlings. The black bars indicate the genomic regions of the genes. The blue arrows indicate the transcriptional directions. Thin bars = 500 bp. B, Schematic diagrams of the upstream regions of CPC, ETC1, ETC3, and TCL2. The vertical lines indicate the potential TCP4-binding motif GGACCA. The black arrows represent the transcriptional start sites. CPC-I: −2,675 to –2,670 bp; CPC-II: −746 to −741 bp; CPC-III: −736 to −731 bp; ETC1-I: −923 to −918 bp; ETC1-II: −794 to −789 bp; ETC1-III: −232 to −227 bp; ETC3-I: −900 to −895 bp; ETC3-II: −857 to −852 bp; TCL2-I: −1,985 to 1,980 bp; TCL2-II: −1,962 to 1,957 bp; TCL2-III: −892 to −877 bp. The blue arrows indicate the primers used for ChIP-PCR assay. C, ChIP-PCR assays using 5-d-old whole wild-type or 35S-Myc-mTCP4 seedlings grown under normal conditions. The promoter regions containing TCP4-binding motif were amplified with the primer pairs named as in Figure 5B (blue arrows). The relative enrichment of the wild-type group was set to 1.0. The TA3 transposon locus was used as a negative control. The data are the means (±se) of three biological replicates. The asterisks indicate the Student’s t test significance. **P < 0.01; ***P < 0.001. D–G, The relative expression levels of R3 MYB genes (D: ETC1; E: ETC3; F: CPC; G: TCL2) in 3- to 7-d-old cotyledons of wild-type and tcp2/3/4/5/10/13/17 plants. The expression level of each gene in 3-d-old wild-type cotyledons was set as 1.0. ACTIN8 was used as the reference gene. The data are the means (±se) of three biological replicates. The asterisks indicate the Student’s t test significance. **P < 0.01; ***P < 0.001.

